What Is a Good MER for ETFs in Canada? Under 0.25% – Here’s Why the Gap Costs $217,000
A good MER for a Canadian ETF is under 0.25%. That number matters more than most people realize, the gap between a 0.20% ETF and a 2.5% bank mutual fund compounds to roughly $217,000 on a $100,000 starting investment over 25 years, with identical market returns. No market timing required. No different strategy. Just fees. This guide covers what the tiers look like, which Canadian ETFs sit in each tier, and how to check any fund’s MER in about 30 seconds.
Educational Disclaimer: The ETFs, funds, and financial products discussed on this website are provided as real-world educational examples to illustrate investing concepts and portfolio fee structures. They are not individualized investment recommendations or endorsements. Comparable products from other providers may exist.
What Is a Good MER for ETFs? A Canadian Investor’s Guide (2026)
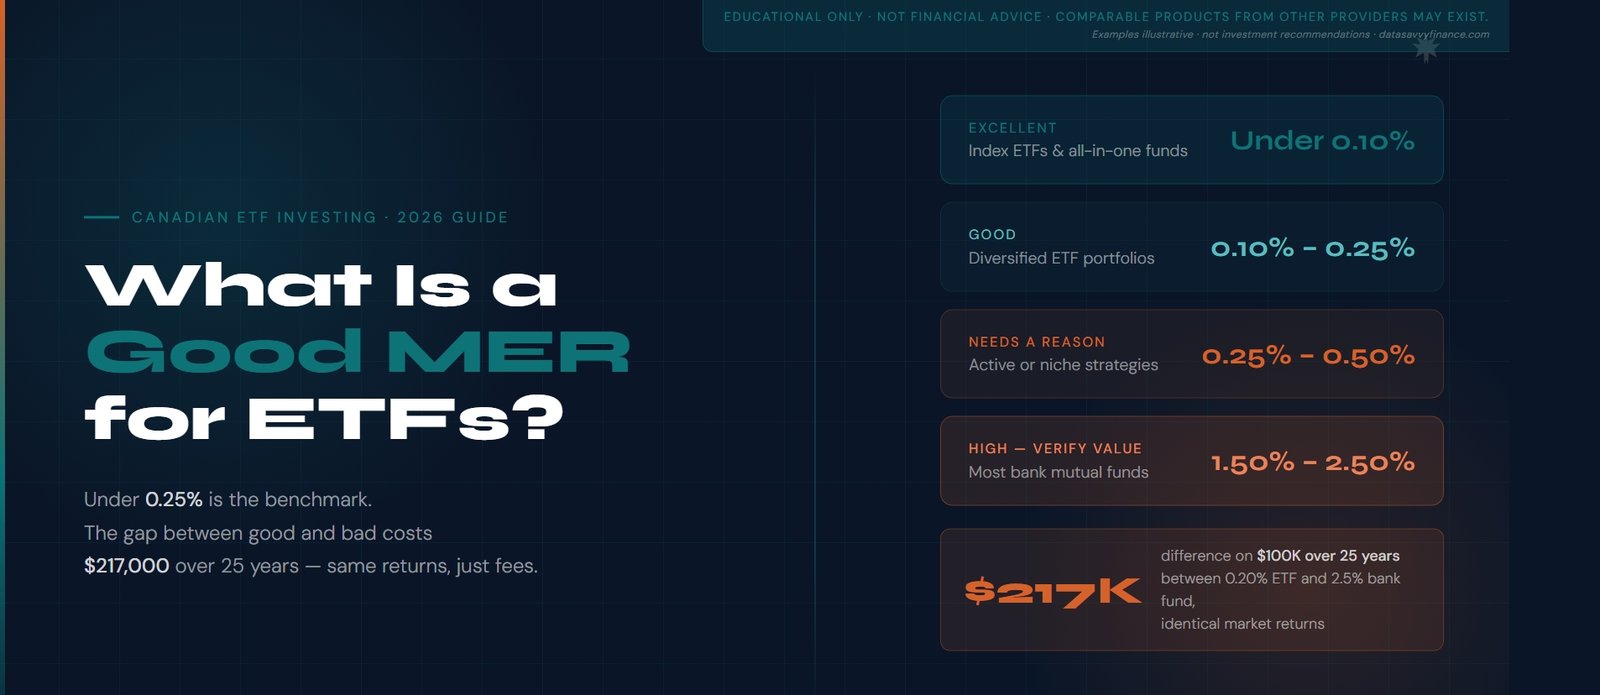
Here’s the short answer before we go any further: a good MER for an ETF in Canada is under 0.25%.
That is the benchmark. Simple. Concrete. And honestly, more useful than anything I heard in my first couple years of investing, when MER was just a term I nodded at without really understanding what it meant in dollar terms.
Here is the number that makes the benchmark matter. A Canadian investor holding a typical bank mutual fund at a 2.5% MER pays roughly $217,000 more in fees over 25 years than one holding an all-in-one ETF at 0.20% — on the exact same $100,000 starting investment, with identical market returns. That gap is entirely the fee. Not the market. Not the strategy. Just what the fund charges to stay invested.
Most people have heard that fees matter. Fewer have actually seen that number. That is what this guide is about.
What Is MER? (The 30-Second Explanation)
MER stands for Management Expense Ratio. It’s the annual percentage a fund charges to keep itself running, covering portfolio management, administration, trading costs, and marketing.
The thing that catches most beginners off guard is how it gets charged. You never receive a bill. The fee is deducted from the fund’s assets automatically, before you ever see your returns. If a fund earned 7% before fees and carries a 0.20% MER, you see 6.80%. The toll gets taken quietly, every single year, whether markets go up or down.
That last part matters. MER isn’t a performance fee. It doesn’t pause during a bad year. It comes out regardless.
Think of it like a silent business partner who takes a percentage of the portfolio annually, without doing anything differently based on results. The lower that cut, the more of the compounding stays in your account.
One thing worth clarifying early: MER is not the same as the management fee, though the two terms get often used interchangeably. More on that distinction in a later section, it’s a small but meaningful difference.
For a deeper look at how MER affects your returns year by year, this breakdown of how MER impacts long-term investment growth shows the compounding effect in detail.
What Is a Good MER for ETFs in Canada?
Here’s a simple tier system to use as your reference point.
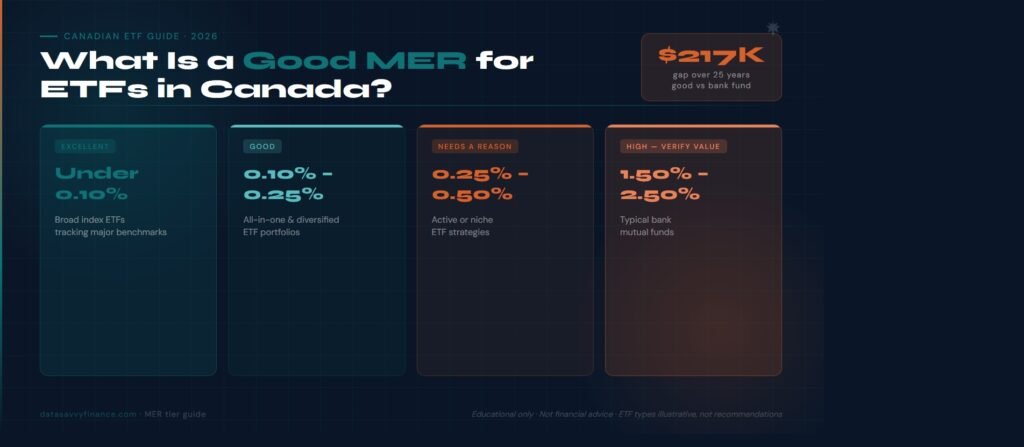
- Excellent (0.03% to 0.10%): The lowest-cost ETFs available. Mostly US-listed funds and a handful of single-asset Canadian ETFs. If you can access these, you’re paying almost nothing to stay invested.
- Very good (0.10% to 0.25%): Where most quality Canadian all-in-one ETFs live. This is the realistic sweet spot for the majority of Canadian self-directed investors.
- Acceptable (0.25% to 0.50%): Sector ETFs and some specialty funds fall here. Not a dealbreaker, but worth asking what the extra cost is buying you.
- Scrutinize (0.50% to 1.00%): The fee needs a clear justification at this level. Active management, niche exposure, or a specific strategy you can’t replicate cheaply. If there’s no good answer, keep looking.
- Need a very good reason for passive investing (1.00% and above): This is typical mutual fund cost. The fee drag at this level compounding over decades is significant.
The one-sentence rule: for a passive, buy-and-hold ETF investor, anything under 0.25% is good and anything over 0.50% needs a reason.
Average MER in Canada, ETFs vs Mutual Funds
The gap between Canadian ETF fees and mutual fund fees is not subtle. Here’s what the numbers actually look like.
I did not fully understand how wide this gap was until I started comparing actual fund documents side by side. The numbers are not subtle. According to the report from the Investment Funds Institute of Canada (IFIC), cited in a Conference Board of Canada report via Investment Executive, the average asset-weighted MER for long-term Canada-listed ETFs was 0.32% in 2023. Over the same period, the average asset-weighted mutual fund MER in Canada had declined to 1.47% from 2.06% a decade earlier.
That 1.47% average still includes fee-based series funds, the ones sold without embedded advisor commissions. Many of the largest mutual funds in Canada still carry MERs above 2%, particularly in the global equity category where funds commonly sit between 2.1% and 2.5%.
For context, Morningstar Canada explains that a fund with a 0.25% MER costs $25 annually for every $10,000 invested. At a 2% MER that same $10,000 costs $200 every year, eight times more, for what is often an identical or inferior underlying index exposure.
| Fund type | Average MER |
| Canadian all-in-one ETFs | 0.19% to 0.25% |
| Canada-listed ETFs (asset-weighted avg.) | 0.32% |
| Canadian mutual funds (asset-weighted avg.) | 1.47% |
| Big bank equity mutual funds | 2.0% to 2.5% |
Canada has historically had some of the highest mutual fund fees in the developed world. Canadian ETFs have closed that gap significantly, but only if investors know to look for them.
How Much Does a High MER Actually Cost You?
This is where the abstract percentage becomes a real number.
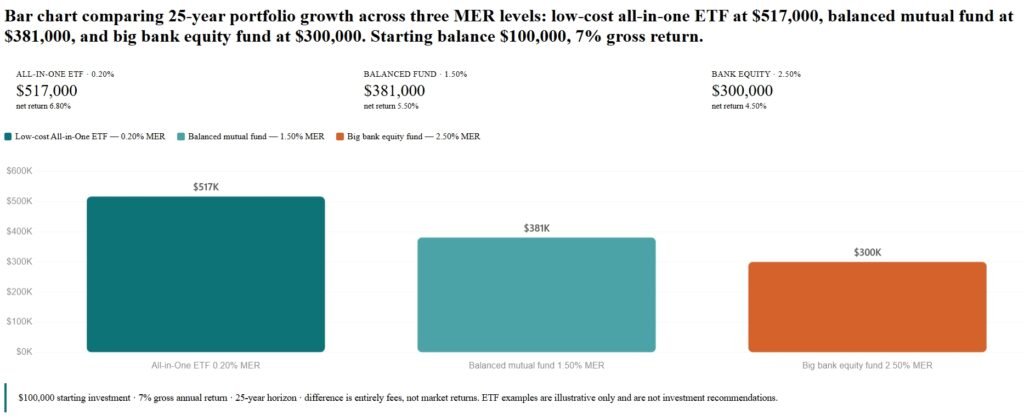
The percentage sounds small. The dollar number does not. Here is what the same $100,000 looks like after 25 years across three different fee levels, assuming 7% gross returns in each case. Here’s a 25-year comparison using three portfolios, all starting with $100,000 and assuming 7% gross annual returns:
| Portfolio | MER | Net return | Ending value (25 yrs) |
|---|---|---|---|
| Low-cost All-in-One ETF | 0.20% | 6.80% | ~$517,000 |
| Balanced mutual fund | 1.50% | 5.50% | ~$381,000 |
| Big bank equity fund | 2.50% | 4.50% | ~$300,000 |
Assumes $100,000 starting investment, 7% gross annual return, 25-year horizon. The difference in ending values is entirely the result of fee drag, not market returns or strategy. ETF examples are illustrative only and are not investment recommendations. Comparable products from other providers may exist.
The difference between the low-cost ETF and the big bank fund is roughly $217,000 on the same $100,000 starting investment with identical market returns. That gap is entirely fees. No difference in strategy, no difference in the underlying markets, just the cost of staying invested.
The reason the gap is so large is (negative, yes you read that right) compounding. A fee taken out in year one doesn’t just cost you that dollar. It costs you every dollar that dollar would have earned over the remaining 24 years. The drag multiplies quietly the whole time.
Want to run this with your own starting amount, contribution schedule, and time horizon? The investment growth calculator lets you model the exact fee impact for your specific situation. Most people find the result more motivating than any financial advice they’ve received. I know I was once I started running these simulations.
MER vs Management Fee. What’s the Difference?
These two terms often get used interchangeably. They mean different things.
The management fee is what the fund pays its portfolio manager. It covers the cost of the investment decisions, picking securities, rebalancing, running the strategy.
The MER is bigger. It includes the management fee plus every other cost of running the fund, administration, legal, accounting, regulatory filings, and marketing. In Canada, taxes on the management fee are also folded in.
A practical example: a fund might advertise a management fee of 0.15%, but once all operating costs are added the MER comes out to 0.20%. That 0.05% difference is real and it compounds just like everything else.
The rule is simple: always compare MERs, not management fees. The management fee is a component. The MER is the true all-in annual cost of holding the fund.
For a deeper breakdown of how MER is calculated line by line, see how the management expense ratio impacts your investment returns.
Low MER ETFs in Canada, Real Examples
I spent way too long overthinking which ETFs to buy when I first started. Simulating and optimizing different portfolios of ETFs was all part of the learning process. Turns out the best ones are also the simplest ones to find.
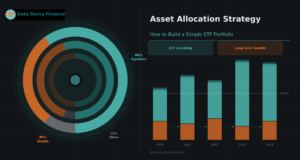
For beginners who want a single fund that handles everything, the all-in-one ETFs are the place to start. These sit around 0.20% MER and give you global equity exposure across thousands of companies in one ticker. Their balanced versions carry the same fee, with a 60/40 stock and bond split for investors who want a smoother ride. All-in-one ETFs of this type are widely available at major Canadian discount brokerages, typically with commission-free ETF purchases.
If you want to build your own allocation, the single-asset options go even lower. ETFS tracking the Canadian total market equity have MER between 0.06% and 0.09%, and Total Canadian Bond ETFs are handled at 0.09%.
One important note: MERs do change. Always verify the current rate on the fund provider’s website before investing. iShares Canada, Vanguard Canada, and BMO ETFs all publish current MERs on their fund pages.
ETF tickers referenced in this section are used as illustrative examples of MER ranges only and are not investment recommendations or endorsements. Comparable products from other providers exist across all categories.
For a full breakdown of how to combine these into a simple portfolio, here’s a practical 3-ETF portfolio strategy for Canadian investors.
When Is a Higher MER Worth Paying?
Honestly, not often. But there are a few situations where it can make sense.
Niche asset classes, things like infrastructure, real estate, or certain alternative strategies, sometimes don’t have low-cost options yet. If you want that exposure, you may have to pay more for it.
Some investors also genuinely benefit from a managed solution. Robo-advisor and managed ETF portfolio services are available at several Canadian brokerages, with combined annual costs that typically range from 0.25% to 0.70% depending on the provider and account balance. For someone who knows they won’t stay disciplined in a down market, the automated rebalancing and simplified experience has real value, the question is whether that value is worth the additional cost relative to a self-directed approach.
The honest bottom line: for a straightforward, buy-and-hold ETF portfolio tracking global markets, a higher MER adds cost without adding anything meaningful in return.
How to Check an ETF’s MER in Canada
This takes about 30 seconds once you know where to look.
The most reliable source is the fund provider’s own website. iShares.ca, Vanguard.ca, and BMO ETFs all list the current MER prominently on each fund’s page. That’s your first stop.
Your brokerage app works too. Most major Canadian brokerages display the MER directly on the ETF detail screen when you search by ticker. Questrade and Wealthsimple are two examples where this information is accessible within the platform, though the display location varies by interface.
For comparing multiple funds side by side, Morningstar Canada is the most thorough free tool available. You can also check the ETF Facts document, which is a standardized disclosure every Canadian ETF is legally required to publish. It lists the MER clearly, usually on page one.
One thing to watch: some sites show the management fee instead of the MER. They’re not the same. Always confirm you’re looking at the MER line specifically.
Conclusion
The benchmark is simple: under 0.25% is good, under 0.10% is excellent, and above 0.50% needs a strong reason.
Fees are the one variable in long-term investing that you can actually control before you start. Returns depend on markets. Markets do what they do. But the cost structure of your portfolio is a decision you make once and live with for decades. The math on that decision — the $217,000 number at the top of this page — does not require optimism about the market. It just requires paying attention to a number that is sitting right there on every fund’s fact sheet.
Run your own numbers with the investment growth calculator below. Plug in your actual balance, contribution schedule, and current MER. Most people find the output more concrete than any conversation about fees they’ve had before, including me, the first time I ran it.
See what your MER is actually costing you
Plug your balance, contribution schedule, and current fund’s MER into the investment growth calculator. The output is in dollar terms, not percentages, so the gap is concrete. Takes about 60 seconds.
Frequently Asked Questions
A good MER for an ETF in Canada is under 0.25%. Example include all-in-one Canadian ETFs like XEQT and VEQT carry MERs of around 0.20%, single-asset ETFs like ZCN and VFV are even lower at 0.06% to 0.09%. Other providers offer low cost ETFs. Anything above 0.50% requires strong justification for a long-term passive investor.
The average asset-weighted MER for Canadian mutual funds was 1.47% as of 2023, according to IFIC data. Many large bank equity funds still carry MERs of 2.0% to 2.5%. By comparison, the average for Canada-listed ETFs was 0.32% over the same period.
The management fee is what the fund pays its portfolio manager. The MER includes the management fee plus all other operating costs, administration, legal, trading, and marketing. MER is always equal to or higher than the management fee and is the true all-in cost of holding a fund.
Yes. MER is charged annually regardless of performance. It is deducted from the fund’s assets before returns are calculated, so you never see it as a separate bill, but it reduces your returns whether the market goes up or down.
The most reliable source is the fund provider’s website, examples include iShares.ca, Vanguard.ca, BMO ETFs, other providers offer similar low-cost ETFs. The MER is also disclosed in the fund’s ETF Facts document, a standardized disclosure required by Canadian securities regulators. Your brokerage app also displays MER on each ETF’s detail page.
Yes, 1% is high for a passive ETF. At that level you are paying five times more than a comparable all-in-one ETFs ( approximately 0.20%). Over 25 years on a $100,000 portfolio, that 0.80% difference compounds into a gap of roughly $80,000 to $100,000 in ending portfolio value depending on market returns.