Asset Allocation ETF Guide: Conservative to All-Equity, Four Portfolios Compared with Real Data (2026)
Before 2018, building a diversified portfolio meant selecting and managing multiple ETFs yourself. Asset allocation ETFs changed that by bundling everything into one fund that rebalances automatically. This guide covers the four main allocation types, conservative at 40% equity through to all-equity at 100%, using real Vanguard fund data, original performance charts from 2020 to 2024, and actual holdings tables for each fund. No guesswork, just the numbers.
Educational disclaimer: This article is for educational and informational purposes only and does not constitute financial, investment, or tax advice. ETF examples and fund allocations are provided for educational illustration only and are not investment recommendations or endorsements. Comparable products from other providers may exist. Consult a registered financial advisor before making any investment decisions.
Introduction
Before 2018, building a diversified ETF portfolio meant selecting and managing multiple funds yourself, deciding how much to put in Canadian equities, how much in global stocks, how much in bonds, and then rebalancing when things drifted. It was doable, but it was not simple.
Asset allocation ETFs changed that. One fund bundles all of that into a single purchase that rebalances automatically. You choose how much risk you want, conservative, balanced, growth, or all-equity, and the fund handles the rest.
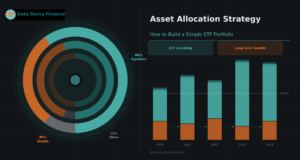
This guide covers the four main allocation types using real Vanguard fund data, original performance charts from 2020 to 2024, and the actual holdings tables for each fund. The data is from public sources and the charts were generated from Yahoo Finance data.
What are Asset Allocation ETFs?
Asset Allocation ETFs represent a unique investment vehicle that combines the traditional exchange-traded funds with the principles of asset allocation. Unlike conventional ETFs that focus on specific asset classes or sectors, Asset Allocation ETFs combines multiple ETFs, primarily focusing on different asset classes like stocks and bonds, to provide a comprehensive, diversified investment solution within a single fund.
ETFs are comprised of same asset class, for example either stocks or bonds, so they are already diversified within asset classes or sector, while asset allocation ETF combines multiple ETFs to further diversify across asset classes, sectors or geographies. For example, SPDR S&P 500 ETF (SPY) includes stocks from the 500 large-cap US companies, which means it’s diversified within the U.S. large-cap stock market but doesn’t include other asset classes like bonds, or assets stocks/bonds from outside US.
Asset Allocation ETFs may combine SPDR S&P 500 ETF (SPY) with ETF fund comprised of US diversified bonds, e.g., iShares Core U.S. Aggregate Bond ETF (AGG) to further diversify the portfolio across asset classes, stocks and bonds. Now this portfolio of stock and bond ETFs is diversified across the two asset classes, but it is not yet diversified geographically, so we may need to choose a third ETF comprising of stocks of international companies.
Understanding Portfolio Construction with ETFs
Portfolio construction with Asset Allocation ETFs involves a strategic approach to selecting a mix of funds that align with an investor’s unique financial objectives, risk tolerance, and time horizon. Instead of allocating capital to individual stocks or bonds, investors can harness the power of diversification by gaining exposure to multiple asset classes, sectors and foreign markets through a professionally selected and managed ETFs.
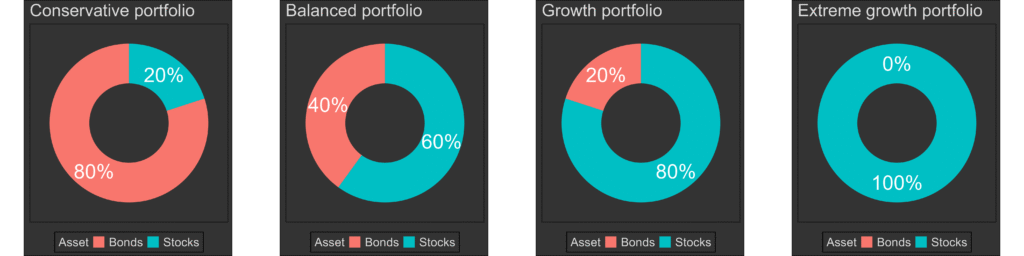
The stocks (i.e. equity class) portion gives more growth power over time but makes the portfolio more susceptible to significant losses. The bonds (i.e., fixed income asset class) do not give much power to grow but it reduces the risks and introduces stability, so the portfolio is less likely to incur significant losses. Combining the two different asses classes (equities and bonds) takes the best of the both worlds, it enables balance between the power to grow while having some level of stability. The (donut) charts above illustrate four different allocations for stocks and bonds and their respective risk level (Conservative, Balanced, Growth, Extreme growth).
If interested, the Canadian portfolio case study example is here.
Are asset allocation funds good?
Pros:
The main structural advantage of asset allocation ETFs is diversification across multiple asset classes in a single purchase. Instead of holding one equity ETF and separately managing a bond ETF, a single asset allocation fund gives you exposure to both, and in the case of global funds, across multiple geographies and sectors as well.
The second practical advantage is simplicity. You do not need to decide on the exact split between Canadian equities, international equities, and bonds, calculate the rebalancing math each year, or execute multiple trades to restore your target allocation. The fund does all of that automatically.
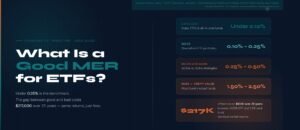
Cost is a third advantage worth noting. Asset allocation ETFs from major Canadian providers typically carry MERs between 0.18% and 0.25%, which is significantly lower than most actively managed mutual funds. That fee difference compounds meaningfully over a 20 to 30 year holding period, as the MER impact charts in this article illustrate.
Cons:
- Not available via brick and mortar banks, these are available via online brokerage accounts.
- It may add up brokerage imposed transactional and loading costs.
- Complexity of managing ETFs can increase, especially when dealing with large numbers of ETFs and their respective allocations.
- Tax implications, although ETFs are tax efficient, taxes can incur for investments held in taxable accounts.
- Managing an all-ETF portfolio can become complex, especially when dealing with a large number of ETFs to achieve desired diversification. This complexity might be overwhelming for less experienced investors.
Why is asset allocation good?
Similarly to the traditional portfolio, asset allocation’s primary role is to maintain stability of the investment over the investment horizon while balancing the appetite for the portfolio returns with risks at acceptable levels.
ETF portfolios are constructed to maintain a target allocation to each asset class, sector or geographical region, having the underlying ETFs periodically rebalanced to ensure the desired target allocations are preserved. Deviations from the target allocations may affect the originally projected returns and risks. This systematic approach to portfolio management ensures that investors can adapt to ever-changing market conditions and ultimately maintain their investment objectives.
For example, a growth asset allocation portfolio may be comprised of ETFs that follow indices of stocks, bonds and cash, with specific higher percentage allocated to the stock assets, smaller percentage allocated to bonds, and miniature percentages allocated to cash. Over time the asset allocation percentages my change, stock portion of the portfolio may grow larger than the target allocation for stocks, reducing the allocated percentages for the bonds and this needs rebalancing. Managers utilize different strategies to portfolio rebalancing, such as buying an holding more of the other asset classes until the original target percentage allocations are restored.
What is a good asset allocation by age?
Asset allocation by age usually pertains to the time when the investor plans to start withdrawing money from the portfolio (e.g., retirement). In retirement portfolios, (for example Vanguard’s target day portfolios) the earlier in the investment horizon, the allocation weight is heavier on the equities part and lower on the bonds part, which allows portfolio growth at increased risk. As the retirement date approaches, the allocation shifts towards fixed income assets such as bonds, to stabilize the risks prepare for fund withdrawals.
For example, during a market downturn it would not be ideal to withdraw funds from the portfolio, as this would mean selling stocks at lower prices, so the investor would have to wait for the market to recover in order to sell stocks and withdraw liquid cash. However, if there is sufficient bond allocation in the portfolio during the market downturn, the investor may receive income from the bonds, providing a more stable source of income.
What is a good portfolio allocation?
ETF tickers referenced throughout this article, including VCNS, VBAL, VGRO, and VEQT, are used as educational examples of asset allocation structures. They are not investment recommendations. Comparable products from other providers may exist. Verify current holdings and fees on the fund provider’s website.
As with traditional portfolio, a good portfolio allocation with depend on investor risk tolerance, time horizon and investment goals. In this section, we’ll explore four common asset allocation strategies:
- Aggressive Growth Allocation
- Conservative allocation
- Balanced Allocation
- Growth Allocation
Conservative Allocation
Conservative allocation typically includes a higher proportion of bonds and a smaller proportion of equities to minimize risk. Allocation Example: 60% Bonds (e.g., bond ETFs), 40% Equities (e.g., equity ETFs). Conservative allocation tends to keep the portfolio value stable even when the stock market experiences fluctuations. Conservative allocations are commonly described in investing literature as being associated with shorter remaining time horizons, where preserving the existing portfolio value takes priority over further growth. For example, at the beginning of the investment years, the goal is to grow the portfolio while maintaining the risk at acceptable levels, but after the portfolio has accomplished it’s goal and it is approaching the time for withdrawals, the portfolio allocations are typically transitioning into conservative allocation to avoid having to deal with withdrawals at the time when the stock market takes a downturn.
For example, the Vanguard Conservative ETF Portfolio (VCNS), as the name suggest, has the following allocation: Stocks 40.59%, bonds 59.36% and short-term reserves 0.05%.
Data Source: Yahoo Finance Data, plots generated with R package quantmod, tidyverse and knitr
Vanguard Conservative ETF Portfolio Fund allocation
Vanguard Conservative ETF Portfolio (VCNS) Fund allocation
Fund
Allocation
Vanguard Canadian Aggregate Bond Index ETF
34.94%
Vanguard U.S. Total Market Index ETF
17.96%
Vanguard Global ex-U.S. Aggregate Bond Index ETF (CAD-hedged)
12.61%
Vanguard FTSE Canada All Cap Index ETF
12.23%
Vanguard U.S. Aggregate Bond Index ETF (CAD-hedged)
11.82%
Vanguard FTSE Developed All Cap ex North America Index ETF
7.47%
Vanguard FTSE Emerging Markets All Cap Index ETF
2.93%
Balanced Allocation
Balanced allocation typically includes approximately similar proportion to stocks and bonds. Allocation Example: 40% Bonds (e.g., bond ETFs), 60% Equities (e.g., equity ETFs). Compared to conservative allocation, balanced allocation comes with the power of stable growth over time.
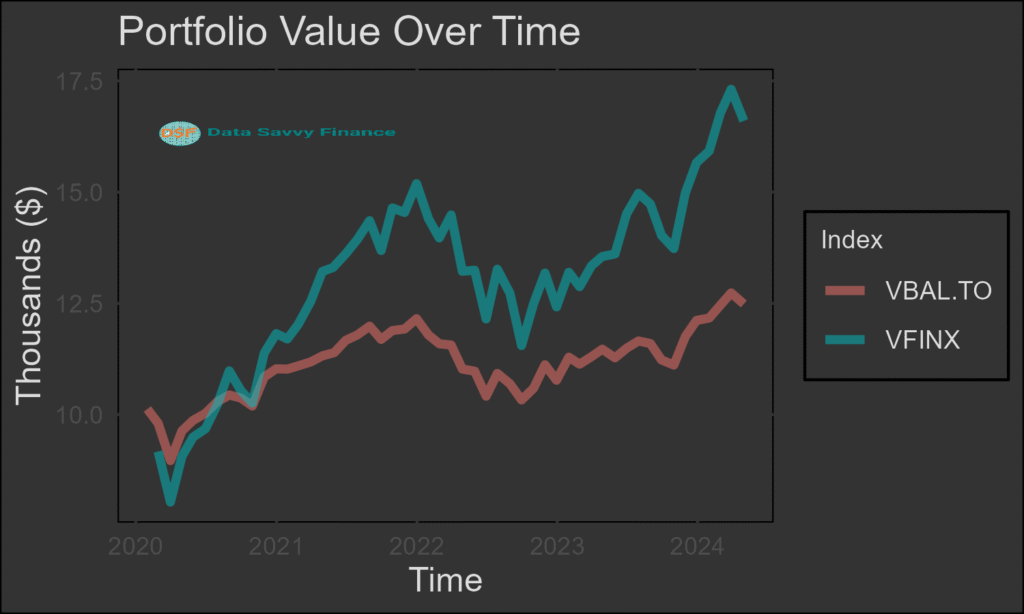
For example, the Vanguard Balanced ETF Portfolio (VBAL), as the name suggest, has the following allocation: Stocks 60.57%, bonds 39.38% and short-term reserves 0.05%.
Investment Portfolio
Vanguard Balanced ETF Portfolio (VBAL)
Fund
Allocation
Vanguard U.S. Total Market Index ETF
26.92%
Vanguard Canadian Aggregate Bond Index ETF
23.32%
Vanguard FTSE Canada All Cap Index ETF
18.11%
Vanguard FTSE Developed All Cap ex North America Index ETF
11.21%
Vanguard Global ex-U.S. Aggregate Bond Index ETF (CAD-hedged)
8.30%
Vanguard U.S. Aggregate Bond Index ETF (CAD-hedged)
7.77%
Vanguard FTSE Emerging Markets All Cap Index ETF
4.32%
Growth Allocation
Growth allocation typically includes large proportion of stocks and a small proportion of bonds. Allocation Example: 20% Bonds (e.g., bond ETFs), 80% Equities (e.g., equity ETFs). The growth allocation, enables the portfolio to grow higher while also having some stability over time. As the name suggests, this allocation structure is associated with longer time horizons where the primary objective is long-term growth rather than short-term stability. Individual circumstances vary significantly, and this article cannot assess suitability for any specific investor.
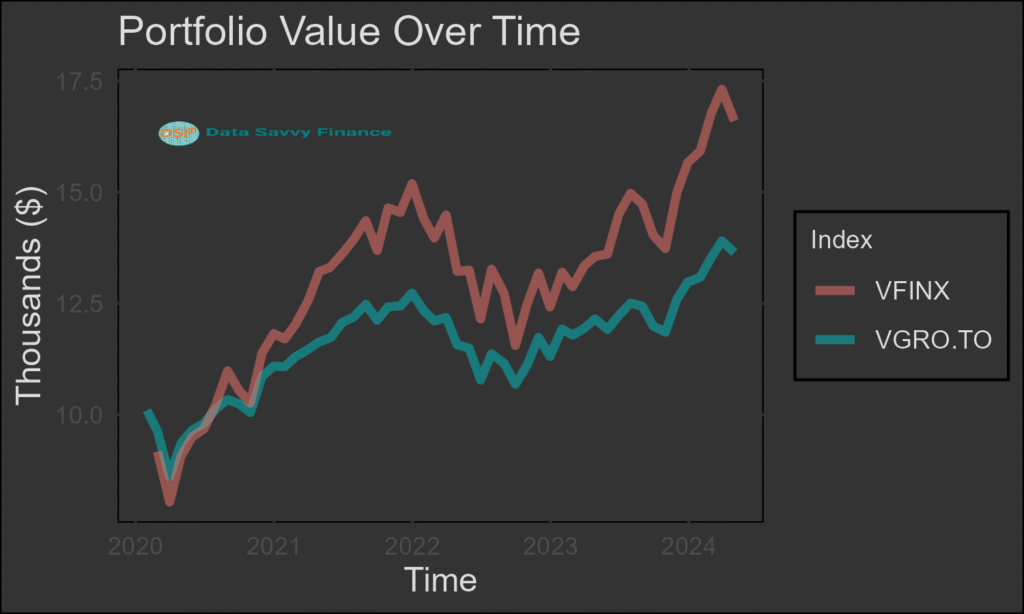
For example, the Vanguard Growth ETF Portfolio (VGRO), has the following allocation: Stocks 80.59%, bonds 19.37% and short-term reserves 0.04%.
Investment Portfolio
Vanguard Growth ETF Portfolio (VGRO)
Fund
Allocation
Vanguard U.S. Total Market Index ETF
36.19%
Vanguard FTSE Canada All Cap Index ETF
23.63%
Vanguard FTSE Developed All Cap ex North America Index ETF
15.30%
Vanguard Canadian Aggregate Bond Index ETF
11.64%
Vanguard FTSE Emerging Markets All Cap Index ETF
5.47%
Vanguard Global ex-U.S. Aggregate Bond Index ETF (CAD-hedged)
3.99%
Vanguard U.S. Aggregate Bond Index ETF (CAD-hedged)
3.74%
Aggressive Growth Allocation
Aggressive growth allocation typically includes large proportion of stocks and no bonds. Allocation Example: 0% Bonds (e.g., bond ETFs), 100% Equities (e.g., equity ETFs). The aggressive growth allocation, enables the portfolio to grow higher. As the name suggests, this allocation is commonly associated with portfolios where the investment horizon is long enough to absorb significant short-term volatility. Whether a 100% equity allocation is appropriate depends on individual circumstances that this article cannot assess..
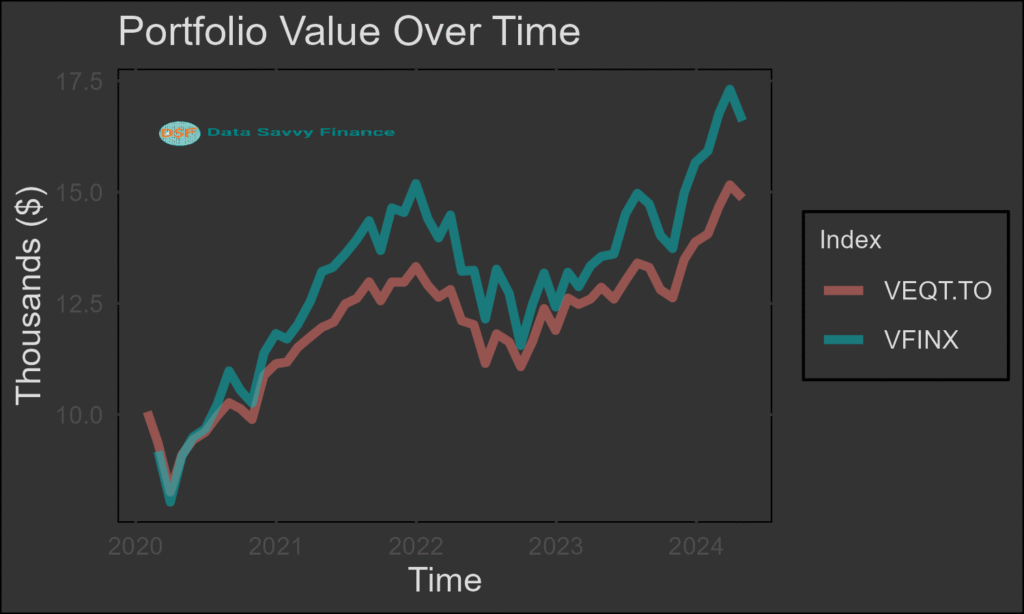
For example, the Vanguard All-Equity ETF Portfolio (VEQT), has the following allocation: Stocks 99.96%, bonds 0.00% and short-term reserves 0.04%.
Vanguard All-Equity ETF Portfolio (VEQT)
Vanguard All-Equity ETF Portfolio (VEQT)
Fund
Allocation
Vanguard U.S. Total Market Index ETF
44.95%
Vanguard FTSE Canada All Cap Index ETF
29.55%
Vanguard FTSE Developed All Cap ex North America Index ETF
18.63%
Vanguard FTSE Emerging Markets All Cap Index ETF
6.83%
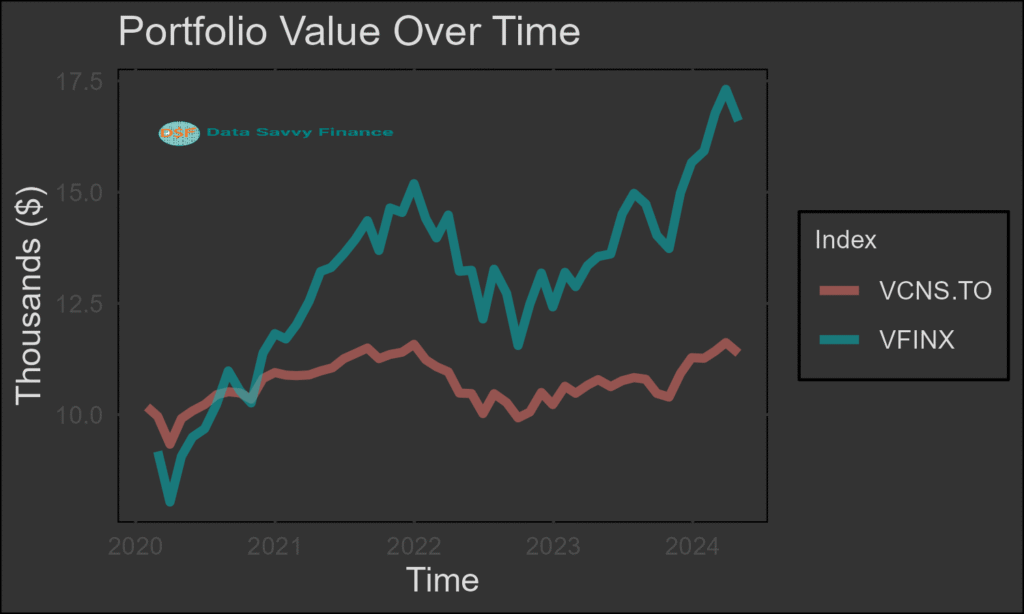
Initial investment of 10,000 on January 1st 2020 would achieve a balance of $14,863 on April 30, 2024, marking an Compound Annualized Growth Rate (CAGR) of 9.58%, as shown in the graph. Compared to a benchmark index fund Vanguard 500 Index Investor (VFINX), which tracks market-cap-weighted portfolios of 500 largest US stocks, the VEQT offers much larger growth than the VCNS, VBAL or VGRO, at the expense of increased risk, as measured by annualized standard deviation of 14.47%. In contrast, VFINX exhibited dramatic growth up to $16,601 marking a CAGR of 12.68%, followed by larger downfall in the 2022 post-pandemic period, exhibiting a much higher risk as measured by annual standard deviation of 19.43%. The risk-adjusted CAGR for VGRO and VFINX are 8.19% and 10.22%, respectively.
Why is the VEQT annualized return and the risk lower than that of VFINX, when they are both based on equities only?
The VEQT fund allocation table above indicates that VEQT comprises geographically diversified ETF stock funds, comprising not only the US total stock index (Vanguard U.S. Total Market Index ETF), but also the Canadian total stock index (Vanguard FTSE Canada All Cap Index ETF), developed except North American stocks (Vanguard FTSE Developed All Cap ex North America Index ETF) and emerging total stock (Vanguard FTSE Emerging Markets All Cap Index ETF) indices. This geographical diversification is the main contributing factor that drives lower risk for the VEQT compared to that of the VFINX, but also reduces the potential growth on the returns.
Portfolio Performance
Metric
VCNS.TO
VBAL.TO
VGRO.TO
VEQT.TO
VFINX
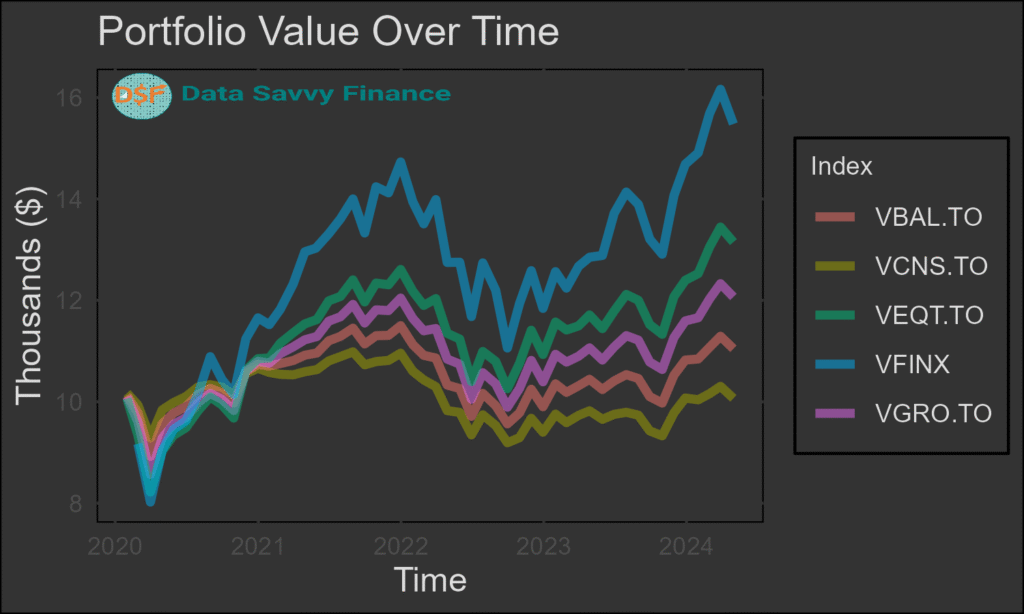
Start balance
10000.00
10000.00
10000.00
10000.00
10000.00
End balance
11380.23
12485.43
13640.83
14863.55
16601.50
AnnualizedReturn
(CAGR)
3.03
5.26
7.43
9.58
12.68
St.Dev Monthly
2.52
3.03
3.60
4.18
5.61
St.Dev annually
8.72
10.50
12.48
14.47
19.43
Risk adjusted CAGR
2.76
4.73
6.54
8.24
10.27
Conclusion
Asset allocation ETFs made diversified portfolio construction accessible to investors who do not want to select and manage multiple individual funds. One purchase gives you exposure across equities and bonds, automatic rebalancing, and a fee structure that is typically far lower than actively managed alternatives.
The four structures covered in this guide, from VCNS at roughly 40% equity through to VEQT at 100% equity, represent the main points on the risk spectrum. The real Vanguard fund data from 2020 to 2024 shows how each allocation actually behaved during a period that included both a sharp COVID-19 decline and a 2022 inflation-driven drawdown. That real-world context is more useful than theoretical descriptions.
For a deeper look at how MER compounds over time across these allocation structures, the MER impact guide at DatasavvyFinance.com walks through the full math. For a comparison of how individual ETF selection compares to using all-in-one funds on total cost, see the low-cost RRSP portfolio guide.
Frequently Asked Questions
An asset allocation ETF is a single fund that holds multiple underlying ETFs across different asset classes, typically stocks and bonds, in a fixed target allocation. Instead of purchasing a Canadian equity ETF, a global equity ETF, and a bond ETF separately and managing the rebalancing yourself, an asset allocation ETF bundles all of that into one fund. The fund automatically rebalances back to its target allocation periodically. Major Canadian providers offer these across four main allocation types: conservative, balanced, growth, and all-equity. ETF examples in this article are for educational illustration only.
Asset allocation ETFs have several structural advantages for long-term investors: automatic rebalancing, low costs typically between 0.18% and 0.25% MER, broad diversification across geographies and asset classes, and simplicity that reduces the number of decisions required. Academic research on passive investing consistently shows that low-cost diversified funds outperform the majority of actively managed strategies over 10-plus year periods, primarily because of fee advantages and reduced behavioural errors. Past performance does not guarantee future results. Whether any specific fund or allocation is appropriate depends on individual circumstances.
All four are Vanguard all-in-one asset allocation ETFs available on the TSX, but they differ in their equity-to-bond ratio. VCNS holds approximately 40% equities and 60% bonds, making it the most conservative. VBAL holds approximately 60% equities and 40% bonds. VGRO holds approximately 80% equities and 20% bonds. VEQT holds approximately 100% equities and 0% bonds, making it the most growth-oriented. The real performance data in this article from 2020 to 2024 shows how those structural differences translated into actual returns and volatility during that specific period. ETF examples are for educational illustration only and are not investment recommendations.
A commonly referenced framework is to subtract your age from 110 to estimate your approximate stock allocation, with the remainder in bonds. At age 30 that produces roughly 80% stocks and 20% bonds. At age 60 it produces roughly 50% stocks and 50% bonds. This is a rough guideline rather than a rule. Individual circumstances including income stability, existing pension or other income sources, risk tolerance, and investment goals all influence what allocation structure is appropriate. This article cannot assess suitability for any specific investor and the framework above should be treated as a starting point for thinking, not a prescription.
Asset allocation ETFs rebalance internally, meaning the fund manager adjusts the underlying ETF weights back to their target allocation periodically. This happens automatically without any action from the investor. As equity markets rise and the equity portion of the portfolio drifts above its target, the fund sells some equity and buys more of the bond component to restore the original allocation. This systematic rebalancing is one of the structural advantages of all-in-one funds compared to managing multiple ETFs manually, where the investor must calculate the rebalancing trades themselves.
Canadian all-in-one asset allocation ETFs from major providers typically carry MERs between 0.18% and 0.25% per year. This is significantly lower than most actively managed Canadian mutual funds, which commonly charge between 1.5% and 2.5% annually. The fee difference of approximately 1.5 to 2 percentage points compounds significantly over long time horizons. For a breakdown of how that fee difference translates into dollar terms over 10, 20, and 25 years, see the MER impact guide and the MER cost calculator worksheet on DatasavvyFinance.com. ETF examples are for educational illustration only.