About Data Savvy Finance
Data-driven investing with probabilistic discipline and cost control.
Transparent math, plain language. No advice, no predictions, no nonsense.
I have a master’s degree in econometrics and I could not read my own investment statements.
Not because they were complicated in any mathematical sense. Because they were designed to be unreadable. There was no consistent data format, no way to reconcile opening balances against contributions against returns. Numbers were presented in ways that made it impossible to reconstruct what happened to my money from one month to the next. I spent years building statistical models for a living and I could not tell, from my own bank’s reports, what my fees were costing me in dollar terms over time.
That is not an accident. That is a business model. The moment I understood that, this site became inevitable.
Where did the skills came from?
I did not start in finance. I started in pure mathematics, where the discipline is simple and unforgiving: state your assumptions, show your working, accept what the logic actually tells you rather than what you hoped it would say.
That foundation led to a master’s in econometrics, the branch of statistics applied to economic and financial data, followed by a PhD focused on building probabilistic models that work transparently with uncertainty rather than pretending the future is knowable. I spent years working in the applied statistics and data science field, helping clients design data collection and analysis protocols that produce results they can trust.
What that background gave me is not the ability to predict markets.
Nobody can do that reliably. What it gave me is the ability to ask the right questions about numbers. What assumptions are baked into this? What uncertainty is being hidden?
What is being presented as certain that is actually not? What does this cost, precisely, in dollar terms, over twenty years? Those questions change everything when you apply them to your own investment portfolio.
The turning point
When I finally pulled apart my own bank investments using the analytical lens, what I found was not subtle. I was paying fees that, compounded over a typical investing horizon, would cost me more than a hundred thousand dollars I would never see. The reports that were supposed to show me this were structured in a way that made the calculation nearly impossible for a normal person to do. The percentage was disclosed, technically. The dollar consequence over time was nowhere.
I grew up in a post-communist country where institutions reset without warning and financial stability was something you built deliberately, not something you inherited or assumed. That background makes me less patient with opacity than most.
When I see a system designed to obscure the cost of itself, I take it personally.
So I built the tools I needed. A fee impact simulation running on real historical data.
A compound growth calculator that shows the dollar gap between a 0.20% MER and a 2.0% MER over thirty years. Worksheets that walk through the calculation step by step. Articles that explain the concepts in plain language, then show the actual math behind them.
What this site is, and what it is not
Data Savvy Finance is not a research institution. It is not affiliated with any university or employer. It does not give financial advice, recommend specific investments for your situation, or tell you what to buy. This is a place where someone with a serious quantitative background does the math that most personal finance content only describes, and makes the tools and analysis publicly available for free.
The simulations are built on real data. The calculator uses mathematically rigorous compounding formulas. The fee analysis is reproducible. When I show you that a 2% MER costs a Canadian investor with a $100,000 portfolio approximately $329,000 in compounded wealth over thirty years, that is not an opinion or an estimate pulled from a press release. It is the output of a model you can verify.
My first articles were too technical. Smart friends read them and told me so directly, which I appreciated. I rebuilt the site around a simpler principle: show the analysis, explain what it means, and make it useful for someone who is managing their own money for the first time and wants to understand it properly rather than just being told what to do. The beginner investor deserves the same quality of analysis that institutional investors take for granted. They are just rarely given it in a form they can use.
In practice
In our household, capital allocation is not abstract. My partner brings an agricultural economics background, a different lens, deeply practical, focused on real assets and long-run cycles. Our daughter, who is six, has a piggy bank divided deliberately into three sections: spending, saving, and investing. Not as a lesson in slogans. As an early introduction to the idea that every dollar has an opportunity cost and that the decision about where it goes is worth making consciously. Financial resilience is built through structure, not through luck or inheritance or trusting that someone else is managing things well on your behalf. This site exists because I stopped trusting that and started checking, and what I found when I checked was worth sharing.
What You Will Find Here?

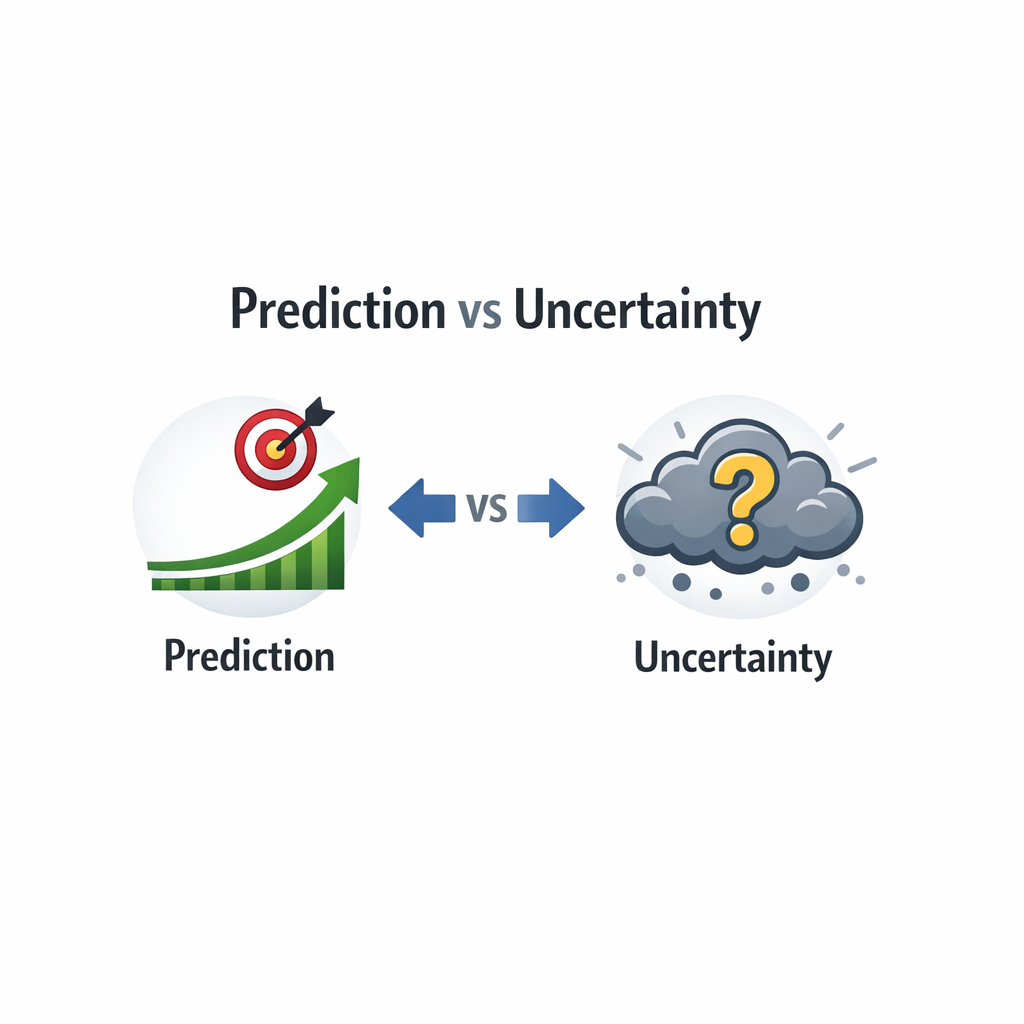

You will not find
- Stock tips.
- Deterministic projections.
- Predictions about where markets are going.
- Fear-based narratives designed to keep you clicking.
You will find
- The math behind investment fees, shown clearly.
- The math behind investment fees, shown clearly.
- Plain-language explanations of concepts that matter for long-term investors.
- Original analysis built on real data, described transparently, with assumptions stated.
What Readers Gain Here
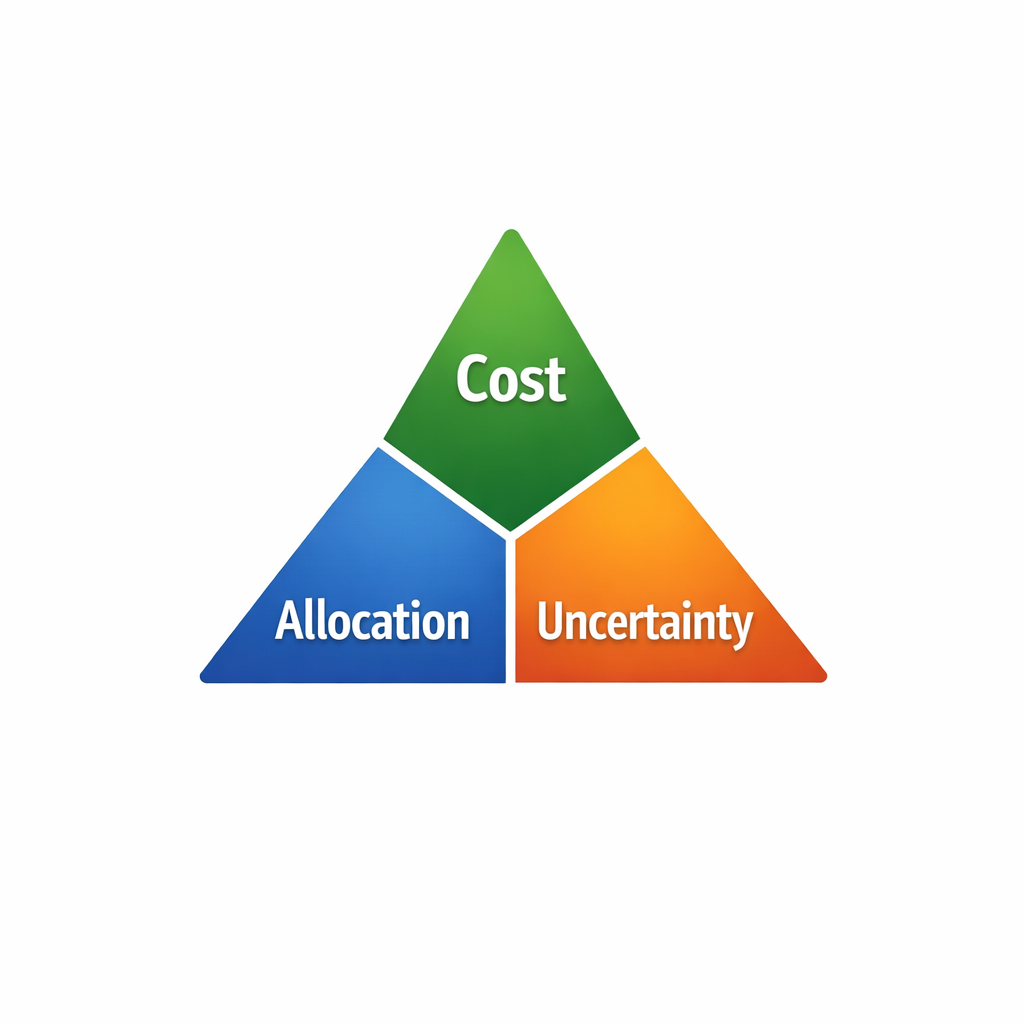
- Learn risk structuring that outlasts predictions
- Understand how costs impact return outcomes
- Build calm, data-informed decision frameworks