Compound Interest Investing: $10,000 at 8% Grows to $217,000 Over 40 Years. Here’s the Math That Makes It Work
Most investors know compound interest is powerful. Fewer have seen what it looks like in dollar terms across 40 years. At 8% annual return, $10,000 becomes $217,245, not from clever picking, just from mathematics and time. At 6.5% after a typical mutual fund fee the same $10,000 becomes $124,000. That $93,000 gap is entirely fees. This guide covers the compounding formula, the fee drag math, the starting-early versus starting-late comparison, and links to a free calculator to model your own numbers.
Educational Disclaimer: These are illustrative projections using fixed annual return assumptions. Actual investment returns vary with market conditions and are not guaranteed. The figures are intended to demonstrate the mathematical impact of return rate differences, not to predict specific outcomes.
Introduction
“Compound interest is the eighth wonder of the world.” The quote is often attributed to Einstein, whether accurate or not, the principle holds.
Most investors underestimate compounding. They focus on returns. They chase performance. They ignore time.
But compound interest investing isn’t about chasing higher returns. It’s about structural growth, allowing capital to reinvest, snowball, and accelerate. A 7% return does not double your money in 14 years because it’s “good”. It doubles because of exponential mathematics.
In this guide, we’ll break down how compound interest works, how to calculate it, and how to design a portfolio that maximizes long-term compounding while minimizing structural drag from fees and taxes.
What Is Compound Interest and How Does It Work?
I’ll be honest. The first time I saw the compound interest formula I almost closed the book. It looked like something that belonged in a calculus class, not in a real-life investing conversation. But once I actually understood what each variable meant, it stopped being scary and started being powerful.
Simple Interest vs Compound Interest
Here’s the simple way I explain it now. Simple interest is interest earned only on your original principal. If you invest $10,000 at 8% simple interest, you earn $800 per year. Every year. That’s it. Flat growth.
Compound interest, on the other hand, earns interest on your principal and on the interest already earned. So in year two, you’re earning 8% not just on $10,000, but on $10,800. That difference seems small early on. It’s not. It becomes massive.
The formula looks like this:
A = P(1 + r/n)^(nt)
Where:
P = principal (starting amount)
r = annual interest rate (decimal form)
n = compounding frequency (times per year)
t = time in years
A = final amount
When I finally broke it down piece by piece, it clicked. The formula isn’t magic. It’s just tracking reinvested growth. And here’s something I learned the hard way: time matters more than chasing higher returns.
Years ago, I obsessed over squeezing out an extra 1–2% in annual return. I thought going from 8% to 10% was everything. But what really moved the needle? Starting earlier and staying invested.
Let’s look at real numbers.
If you invest $10,000 for 30 years:
At 6% annual return, it grows to about $57,435
At 8% annual return, it becomes roughly $100,627
At 10% annual return, it reaches about $174,494
Notice something? The jump from 6% to 8% adds over $43,000. The jump from 8% to 10% adds nearly $74,000. That’s exponential growth doing its thing.
If you delay investing by 10 years, even at 10%, you often end up worse off than someone who started earlier at 6%. I’ve seen this play out in retirement projections more times than I can count. It’s frustrating. And honestly, it’s a little humbling.
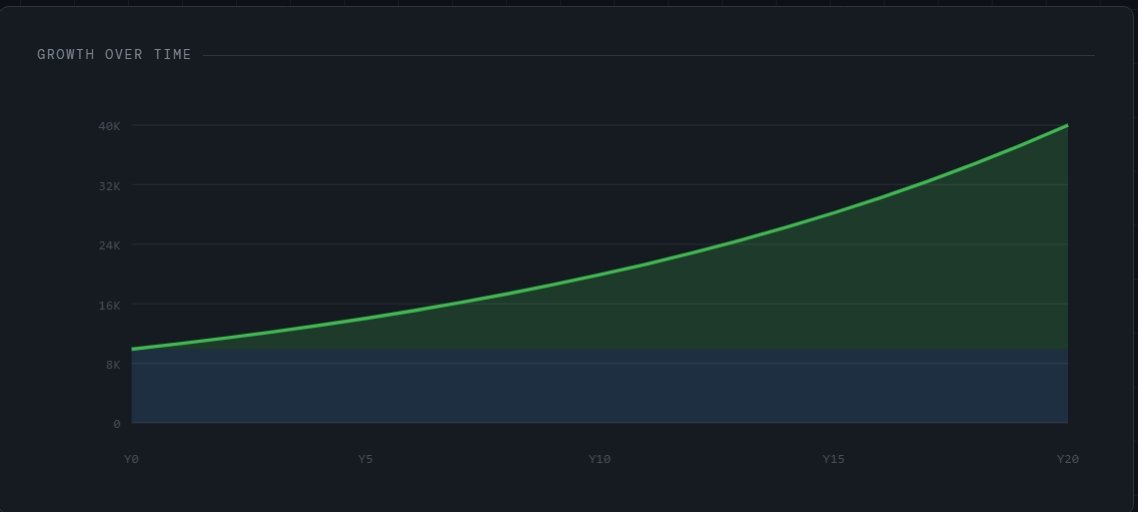
Compound growth doesn’t look impressive in the first 5 years. It feels slow. Kind of boring. The curve is almost flat. Then around year 15 or 20, it starts bending upward. That upward bend? That’s the exponential growth curve in action.
Mathematically, it’s because your base keeps getting larger. Each year’s return is calculated on a bigger number. Visually, if you graph it, it looks like a gentle slope that suddenly turns into a steep climb. That steep part, that’s where wealth acceleration happens.
And most people quit before they get there.
If I could give one practical tip, it would be this: stop checking your portfolio every week. Compounding needs years, not days. Focus on consistent returns, reinvested dividends, and low fees. Make the math work for you.
Because once compounding starts snowballing, it doesn’t need motivation. It just needs time.
The Impact of Starting Early vs Delaying Investment
I used to think waiting a few years wouldn’t matter much. I told myself I’d invest “once things settled down.” That delay cost more than I realized, and it wasn’t because of a bad stock pick. It was because of lost compound growth.
Here’s the math that hit me hard. If you invest $5,000 per year starting at age 25 and earn an average annual return of 8%, by age 55 you’d have about $617,000. If you wait until 35 and invest the same $5,000 per year at 8%, you end up with roughly $245,000. Same contribution. Same rate of return. Ten-year delay. That gap is brutal. This assumes contributions are made at the start of each period
Compounding acceleration really kicks in after 15–20 years. The first decade feels slow. You’re watching your portfolio crawl from $10,000 to maybe $22,000 or $25,000 and it doesn’t feel life-changing. But around year 18 or 20, the growth curve bends upward.
That’s when exponential growth becomes visible. The portfolio starts earning more from reinvested dividends and capital gains than from your actual contributions. That part was mind-blowing to me. It felt like the money was finally working harder than I was.
Now let’s talk about the cost of sitting in cash. I parked money in a savings account earning 1% because I was “waiting for a correction.” Inflation was around 3%. So in real return terms, I was losing about 2% per year.
It wasn’t obvious at first. But purchasing power was quietly being eroded. That’s how opportunity cost works, it’s invisible until you run the numbers.
And missing the best market days? That one stings. Data shows that missing just the 10 best market days over a 20-year period can cut your total return almost in half. Many of those best days happen right after major market declines. So if you panic-sell during volatility, you often miss the rebound. I did that once. Sold during a downturn, felt smart for a few weeks, then watched the market recover without me.
Behavioral finance
Behavioral finance is real. Loss aversion is powerful. Impatience is dangerous. Compounding requires time in the market, not timing the market. But our brains don’t love waiting. We want action. We want to “do something.” That urge has wrecked more portfolios than bad math ever did.
One strategy that helped me stay disciplined was dollar-cost averaging. Setting up automatic monthly investments into broad-market index funds removed emotion from the process. Whether the market was up or down, money was invested. No debate.
Consistent contributions smooth out volatility over time. When prices are lower, you buy more shares. When prices are higher, you buy fewer. Over decades, that systematic investing approach supports long-term wealth building.
If I could give one piece of advice, it would be this: start now, even if the amount feels small. A $200 monthly investment earning 7–8% over 30 years grows far more than most people expect. But only if time is allowed to do its thing.
Compounding doesn’t reward hesitation. It rewards patience. And patience, honestly, is harder than math.
The Role of Return Rate in Compound Interest Investing
When I first started paying attention to my annual return rate, I treated 1% like it was nothing. Six percent, seven percent… what’s the difference, right? It sounded small. Almost petty to worry about. But once I ran the compound interest formula on a 30- or 40-year investment time horizon, I realized that 1% isn’t small at all, it’s massive.
Let’s walk through the math because this is where exponential investment growth becomes real.
If you invest $10,000 for 40 years and earn:
6% average annual return, you end up with about $102,857
7% annual return, you get roughly $149,745
8% annual return, you reach about $217,245
That 2% difference between 6% and 8% doesn’t just add a little boost. It more than doubles your ending wealth. That’s compound growth investing doing its thing.
And it gets even more dramatic when consistent contributions are added. If you invest $500 per month for 40 years at 6%, you accumulate about $1 million. At 8%, that number jumps to around $1.77 million. Same behavior. Same dollar cost averaging. Just a higher portfolio growth rate.
These are illustrative projections using fixed return assumptions.
Actual investment returns vary and are not guaranteed.
Now here’s where I made a mistake.
I thought the answer was simple: just chase higher returns. Find the strategy that delivers 10% instead of 7% and problem solved. Easy, right? Not exactly.
Raw return and risk-adjusted returns are not the same thing. An investment might average 10%, but if it comes with extreme volatility, say 40% drawdowns most investors won’t stay invested long enough for investment compounding to work. Volatility disrupts compounding because people sell. I’ve seen it happen. I’ve done it once. That emotional decision erased years of growth.
Compounding depends on consistency. A smoother 7% return with lower volatility often beats a chaotic 10% strategy that investors abandon during downturns. This is where portfolio allocation strategy matters. Equity allocation must match your risk tolerance, not just your ambition.
There’s also the management expense ratio impact to consider. A 1% fee drag investing over 40 years reduces ending value dramatically. That fee reduces your real rate of return, which compounds against you. Gross vs net return matters more than most people realize.
And inflation adjusted returns? Also critical.
If you earn 8% but inflation runs at 3%, your real return is 5%. That’s the number that actually builds purchasing power. Tax efficient investing and tax advantaged accounts like RRSP investing, TFSA investing, 401k compound growth, or IRA investment growth help protect that net return after fees and taxes.
The biggest lesson I’ve learned is this: compounding rewards disciplined, risk-aware investing. Not greed.
Balancing equity allocation, using index fund compounding or ETF investing long term, reinvesting dividends through a dividend reinvestment strategy (DRIP investing), and sticking with a buy and hold investing mindset, that’s what drives long term wealth building.
The goal isn’t to maximize returns at all costs. It’s to optimize them for sustainability.
Because compounding only works if you’re still in the game.
The Hidden Enemies of Compounding
When I first learned about compound growth investing, I was obsessed with annual return rate. Eight percent sounded amazing. Ten percent sounded even better. What I completely ignored? The quiet forces that were slowly reducing my investment compounding behind the scenes.
Fees, Taxes, and Inflation. They don’t look dramatic. There’s no market crash headline. No red flashing warning. But over a 25–40 year investment time horizon, they quietly eat away at long-term wealth building.
Let’s start with management expense ratios (MER). A 1.5% mutual fund fee doesn’t sound like a big deal when markets are returning 8%. But here’s what actually happens.
If your gross return is 8% and your MER is 1.5%, your net return after fees becomes 6.5%. Over 40 years, that difference is huge.
For example, $100,000 invested for 40 years:
At 8% grows to about $2.17 million
At 6.5% grows to about $1.24 million
That’s nearly a $931,000 difference caused purely by fee drag investing. The money wasn’t “lost” in one moment. It was slowly siphoned away by compounding against you.
That’s what fee drag really is, negative compounding.
Tax efficient investment strategies
If capital gains and dividends aren’t sheltered in tax advantaged accounts like RRSP investing, TFSA investing, 401(k) compound growth, or IRA investment growth, you lose part of your return each year. That reduces the base amount that compounds forward.
Tax efficient investing strategies matter more than most investors realize. Holding tax-inefficient assets in registered accounts. Using index fund compounding instead of high-turnover strategies. Minimizing realized capital gains. These decisions protect your real rate of return.
And then there’s inflation. Nominal return is what your portfolio earns on paper. Real return is what’s left after inflation. If you earn 7% but inflation runs at 3%, your inflation adjusted return is 4%.
Over decades, that difference shapes purchasing power. A retirement portfolio that looks large nominally may not stretch as far if inflation wasn’t accounted for in retirement planning projections.
I once reviewed a long-term stock market returns chart and felt confident about a 9% average return. Then I adjusted for historical inflation. Suddenly, it was closer to 6% real return. It wasn’t wrong, but it was humbling.
Gross vs net return is a concept that should be tattooed on every investor’s brain. Gross return is marketing. Net return builds wealth.
Compound interest formula doesn’t care why your rate drops. Whether it’s MER, taxes, or inflation, the exponential investment growth curve simply adjusts downward. And that smaller rate compounds for decades.
The lesson I’ve learned? Protect the base, utilize low-cost ETFs using passive investing strategies. Systematic portfolio management. Proper portfolio allocation strategy inside tax-advantaged accounts. Dividend reinvestment strategy through DRIP investing. These aren’t flashy decisions, but they preserve capital gains compounding.
Compounding is powerful. But it’s fragile if neglected.
If you want financial independence investing to actually work, you must control what you can: fees, taxes, and structural efficiency. Because what isn’t controlled will compound against you.
How to Build a Portfolio Designed for Compound Growth
If there’s one thing I wish I understood earlier, it’s this: compound growth investing doesn’t happen by accident. It has to be designed. Not in a complicated, Wall Street way, but in a structural, disciplined way.
When I first started, my “strategy” was basically stock picking mixed with optimism. I’d read about a company, get excited about future value, and buy. Sometimes it worked. Sometimes it didn’t. What I didn’t realize was that volatility and compounding don’t mix well when emotions are involved.
Asset allocation strategy
Everything changed when I began thinking in terms of portfolio allocation strategy. Asset allocation is the foundation of long term wealth building. The mix between equities and fixed income determines your annual return rate, your drawdowns, and your ability to stay invested. For long-term capital growth, an equity allocation of 70–90% historically delivered stronger portfolio growth rates, but only if the investment time horizon was long enough (based on historical data past returns do not guarantee future results)”.
That part matters.
If your timeline is 25–40 years, short-term volatility becomes noise. But if you panic during a 30% decline and sell, the compound interest formula stops working. Market timing vs time in market isn’t just a cliché, it’s a mathematical reality.
I eventually shifted toward diversified ETFs instead of individual stock picking. Why? Because index fund compounding is consistent. Broad-market ETFs reduce single-company risk, lower the management expense ratio impact, and improve risk adjusted returns over time.
Lower fee drag investing means higher net return after fees. Gross vs net return matters a lot more over 40 years than most investors realize.
Rebalancing was another lesson learned through frustration. Early on, I never rebalanced. My equity allocation drifted upward during bull markets. Then when downturns hit, the volatility felt worse than expected.
A simple annual portfolio rebalancing strategy brought compounding stability back. It forced me to trim overperforming assets and add to underperforming ones. Not emotionally. Systematically.
Automating monthly contributions
That’s where systematic investing becomes powerful. Automating monthly investment growth through dollar cost averaging removed decision fatigue. Money was invested regardless of headlines. That discipline supports capital gains compounding and dividend reinvestment strategy (DRIP investing) without constant second-guessing.
And yes, long-term equity bias matters for exponential investment growth. Historically, long term stock market returns have outpaced bonds and cash after adjusting for inflation adjusted returns. But equity exposure must align with risk tolerance. Risk adjusted returns are more sustainable than chasing raw performance.
Tax efficient investing inside tax advantaged accounts like RRSP investing, TFSA investing, 401k compound growth, or IRA investment growth protects real rate of return. That structural efficiency compounds quietly in the background.
The most important rule I’ve learned? Stay invested during downturns. Drawdowns are temporary. Compounding interruption can be permanent if you exit at the wrong time. Investment discipline is more valuable than clever portfolio optimization tricks.
Compound growth isn’t built from excitement. It’s built from allocation, low costs, rebalancing, and patience.
Design the structure. Then let time do the heavy lifting.
Compound Interest Calculator and Practical Examples
I used to nod along whenever someone mentioned the compound interest formula, but if I’m being honest, I didn’t truly feel the power of exponential investment growth until I started running the numbers myself. A compound interest calculator changed everything for me. It made long term wealth building tangible instead of theoretical.
Let’s start simple.
The manual way to calculate compound growth uses the formula:
A = P(1 + r/n)^(nt)
Where:
P = principal
r = annual return rate
n = compounding frequency
t = time
If you invest $20,000 at 7% annually for 30 years (compounded once per year), it becomes:
20,000 × (1.07)^30 ≈ $152,245
That’s investment compounding at work. No additional contributions. Just time and reinvested dividends.
Now, most people don’t calculate this by hand. A compound interest calculator makes it easier. You plug in principal, expected portfolio growth rate, monthly investment growth, and investment time horizon, and you instantly see retirement savings growth projections.
That visual projection matters.
When I started adding monthly contributions, say $500 per month at 7% for 30 years, the result jumped to roughly $719,010. That’s dollar cost averaging layered onto compound growth investing. The combination of systematic investing and time is powerful.
The Rule of 72 is another tool I lean on when explaining investment compounding. It estimates how long it takes money to double.
72 ÷ annual return rate = years to double
At 6% return → money doubles in about 12 years
At 8% return → about 9 years
At 10% return → roughly 7 years
It’s not perfect math, but it’s practical. And it helps compare investment return scenarios quickly.
Scenario planning
Scenario planning is where things get serious. If you assume a conservative 5% inflation adjusted return versus an aggressive 8% nominal return, your retirement planning projections will differ dramatically. For example:
$500/month for 35 years:
At 5% → ≈ $568,046
At 8% → ≈ $1,146,941
That’s why understanding gross vs net return and real rate of return is essential. Management expense ratio impact, fee drag investing, and taxes all lower your effective annual return rate.
When building projections, I like to model three cases:
Conservative (4–5% real return)
Moderate (6–7% long term stock market returns assumption)
Aggressive (8–9% historical equity allocation scenario)
This approach helps balance optimism with risk adjusted returns. It prevents unrealistic expectations, which can lead to poor behavioral finance investing decisions later.
Compound interest example tables are helpful, but they don’t account for volatility and compounding interruptions caused by panic selling. That’s why investment discipline and buy and hold investing matter just as much as the future value formula.
The calculator shows what’s possible. Your behavior determines whether it happens.
When you see capital gains compounding laid out over 30 or 40 years, especially inside tax advantaged accounts like RRSP investing, TFSA investing, 401k compound growth, or IRA investment growth, the math becomes motivating.
Compound interest calculators don’t predict the future. But they do illustrate one truth clearly:
Time + consistent investing + reasonable assumptions = exponential financial growth strategy.
And once you see that curve bend upward, it’s hard to ignore.
Explore our investment growth calculator.
Common Mistakes That Destroy Compound Growth
If compound growth investing is the engine of long term wealth building, then behavior is the steering wheel. And I’ve seen, and personally made, enough mistakes to know that exponential investment growth can be quietly derailed long before the compound interest formula has time to work.
The math is simple. The execution is not.
Let’s start with frequent trading. Early on, I thought being active meant being intelligent. I monitored short-term charts, reacted to headlines, and rotated positions constantly. What I didn’t appreciate was how turnover disrupts investment compounding. Every trade creates friction, spreads, taxes, potential mistakes. Capital gains compounding works best when capital is left undisturbed.
High turnover portfolios often look sophisticated. But when you compare investment performance over time, low-cost index fund compounding frequently outpaces active trading after accounting for management expense ratio impact and net return after fees. The more you interfere, the less smooth the portfolio growth rate becomes.
Emotional selling during market crashes
Emotional selling during market crashes is even more destructive. Volatility and compounding don’t mix well when fear takes control. A 30% drawdown feels unbearable in the moment. But exiting during a downturn locks in losses and removes you from the recovery phase. Market timing vs time in market isn’t theoretical, missing even a handful of strong rebound days can dramatically reduce long term stock market returns.
The compounding curve depends on staying invested.
Over-leveraging is another silent destroyer. Borrowed money amplifies both gains and losses. A leveraged portfolio experiencing a sharp decline may be forced to liquidate at precisely the wrong time. That interruption permanently damages long term capital growth. Risk adjusted returns matter more than maximizing raw annual return rate.
Ignoring asset allocation discipline creates instability. When equity allocation drifts too high during bull markets, volatility increases beyond your risk tolerance. Without periodic portfolio rebalancing strategy, the structure shifts. Then when downturns occur, panic follows. Systematic portfolio management, not impulse, protects compounding.
Underestimating fee impact is perhaps the most underestimated error. A 1% fee drag investing over 35 or 40 years meaningfully reduces wealth accumulation strategy outcomes. Gross vs net return must always be evaluated. A passive investing strategy with ETF investing long term often improves real rate of return simply by reducing structural costs.
Taxes also matter. Tax efficient investing within tax advantaged accounts like RRSP investing, TFSA investing, 401k compound growth, or IRA investment growth preserves more reinvested dividends and capital gains compounding. Inflation adjusted returns should be considered when modeling retirement planning projections.
One thing that helped me recalibrate was using a compound interest calculator to compare scenarios. Small changes in annual return rate, turnover, or fee structure produced surprisingly large differences in future value formula outputs.
Compound growth rewards patience. Dollar cost averaging, disciplined equity allocation, dividend reinvestment strategy (DRIP investing), and buy and hold investing reduce behavioral finance investing errors.
Compound interest doesn’t fail because the math is wrong.
It fails because discipline breaks.
If you want financial independence investing to succeed, focus less on optimization tricks and more on consistency. Protect your time horizon. Minimize friction. Let systematic investing do its quiet work.
Because once compounding is interrupted, restarting it is much harder than maintaining it.
Conclusion
Compound interest investing is not a strategy, it is a structural reality. The question is whether your portfolio is aligned with it.
Time, consistency, cost control, and disciplined asset allocation are the real drivers of long-term wealth. Not market predictions. Not stock picking hype.
The earlier you start, the longer you stay invested, and the lower your structural drag, the more powerful compounding becomes.
Design your portfolio for exponential growth, and then give it time to work.
Frequently Asked Questions
The compound interest formula is A = P(1 + r/n)^(nt), where A is the final amount, P is the principal, r is the annual interest rate in decimal form, n is the number of times interest compounds per year, and t is time in years. For most long-term investing scenarios, annual compounding (n=1) is used as a simplification. The key insight of the formula is that interest is calculated on the accumulated total each period, not just the original principal, this is what creates exponential growth over time.
At an 8% average annual return, $10,000 grows to approximately $217,245 over 40 years using annual compounding. At 6%, the same $10,000 grows to about $102,857. At 10%, it reaches approximately $452,593. These are illustrative calculations using fixed return assumptions. Actual investment returns vary with market conditions and are not guaranteed. The figures demonstrate the mathematical impact of return rate and time on compound growth.
The Rule of 72 is a quick estimation method for calculating how long it takes an investment to double at a given annual return rate. You divide 72 by the annual return percentage. At 6% return, money doubles in approximately 12 years. At 8%, it doubles in about 9 years. At 10%, roughly 7 years. The Rule of 72 is an approximation, the actual doubling time uses the compound interest formula, but it is accurate enough for most planning purposes and useful for quickly comparing investment scenarios.
The impact depends on the starting balance and assumed gross return, but the compounding math is significant. At 8% gross return on $100,000 over 40 years, the portfolio grows to approximately $2,172,000. At 6.5% net return (after a 1.5% fee), it grows to approximately $1,240,000. The difference is approximately $932,000, caused entirely by fee drag compounding against returns over 40 years. The investment growth calculator at DatasavvyFinance.com allows you to model this with your own starting balance, fee level, and time horizon. These are illustrative projections using fixed return assumptions. Actual results vary.
Simple interest calculates returns only on the original principal. If you invest $10,000 at 8% simple interest, you earn $800 every year regardless of the balance. Compound interest calculates returns on both the original principal and all accumulated interest. In year two, you earn 8% on $10,800, not $10,000. This difference seems small early on but becomes large over long time horizons. Over 30 years, $10,000 at 8% simple interest grows to $34,000. The same investment with annual compounding grows to approximately $100,627, nearly three times as much.
Starting earlier has a disproportionate impact on compound interest outcomes because the earliest contributions have the longest time to compound. Investing $5,000 per year starting at age 25 at 8% average annual return produces approximately $617,000 by age 55. Waiting until age 35 to invest the same amount at the same rate produces approximately $245,000 by age 55. The ten-year delay costs roughly $372,000 in ending value despite identical contribution amounts and return rates. This illustrates why time in market, not timing the market, is the primary driver of compound growth outcomes. These are illustrative projections and actual results vary.
Fee drag is the compounding reduction in portfolio value caused by annual management fees. Because fees reduce the net return rate, they compound against the investor over time in the same way that positive returns compound in their favour. A 1.5% annual fee on a portfolio earning 8% gross reduces the net return to 6.5%. Over long time horizons, that 1.5% reduction compounds into a significant dollar gap. Fee drag is most commonly encountered through mutual fund management expense ratios (MERs) and is one reason low-cost ETF portfolios tend to accumulate more wealth than higher-fee alternatives over equivalent time periods. The exact impact depends on portfolio size, time horizon, and fee level.
Inflation reduces the real (purchasing power) value of investment returns. If a portfolio earns 8% nominal annual return and inflation runs at 3%, the real return is approximately 5%. The compound growth calculation using the nominal 8% looks larger, but the actual purchasing power of the ending balance is lower than the nominal figure suggests. For long-term retirement planning, modelling both nominal and inflation-adjusted return scenarios provides a more realistic picture of future purchasing power. Tax-advantaged accounts such as RRSPs and TFSAs help protect real returns by deferring or eliminating tax on gains, but do not directly offset inflation.