TradingView Review (Canada, 2026): What It Does Well, and What a Passive ETF Investor Can Skip
An honest TradingView review for Canadian ETF investors: what the free plan covers, what the paid tiers cost in CAD, and why most can stay free.
Investment tools can clarify decisions, when used properly. In this section, we provide practical guides to portfolio analysis platforms, backtesting tools, and data visualization resources. Rather than chasing optimization, we focus on understanding risk, return dispersion, and the limitations of historical simulations.

An honest TradingView review for Canadian ETF investors: what the free plan covers, what the paid tiers cost in CAD, and why most can stay free.

Empower doesn’t work in Canada. Here’s how Canadian ETF investors track their real after-fee return, with an honest look at Sharesight and the alternatives.
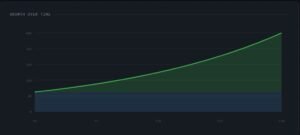
Most investors know compound interest is powerful. Fewer have seen what it looks like in dollar terms across 40 years. At 8% annual return, $10,000 becomes $217,245 — not from clever picking, just from mathematics and time. At 6.5% (after a 1.5% mutual fund fee) it becomes $124,000 instead. That $93,000 gap is entirely fees. This guide covers the full compounding formula, the fee drag math, the starting-early vs starting-late comparison, and links to a free calculator so you can model your own numbers.
Most Portfolio Visualizer tutorials online were written for US investors. That was a problem when I first started using the tool, because the examples, the ETF tickers, the benchmarks, none of it translated cleanly to a Canadian RRSP or TFSA.