The 3-ETF Portfolio for Canadian Investors: 0.17% Combined MER, Global Diversification, 30 Minutes a Year
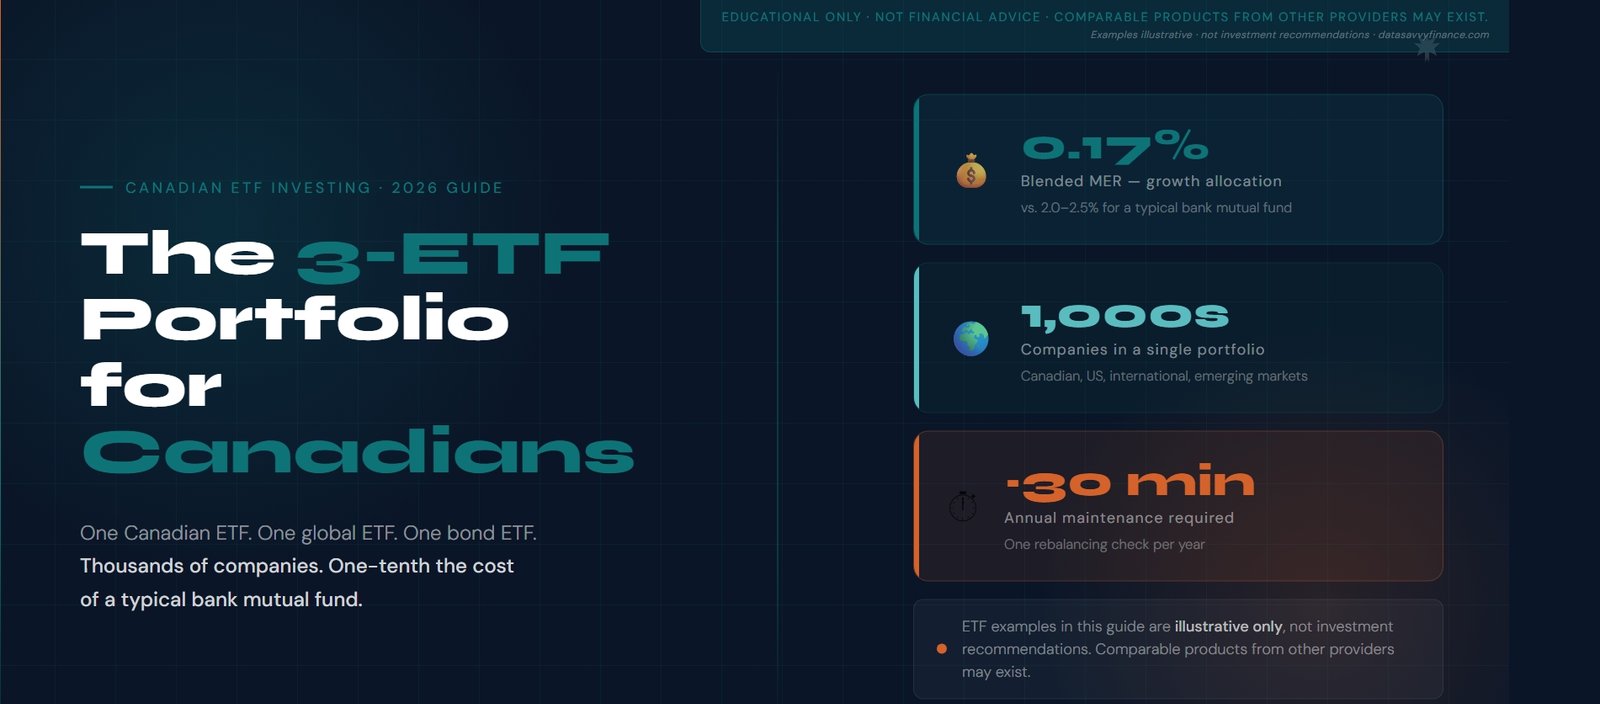
You do not need a complicated portfolio to build serious long-term wealth as a Canadian investor. Three ETFs, one covering Canadian stocks, one covering global stocks, one covering bonds, give you exposure to thousands of companies worldwide at a blended MER of approximately 0.17%. That is roughly one-tenth the cost of a typical bank mutual fund. Total annual maintenance: about 30 minutes. This guide covers the three building blocks, sample allocations for different situations, the actual cost breakdown, without turning it into a second job.
Educational Disclaimer: This article describes a portfolio structure used in Canadian index investing for educational purposes only. It does not constitute financial, investment, or tax advice. ETF examples are illustrative only and are not investment recommendations. Comparable products from other providers may exist. Consult a registered financial advisor before making any investment decisions.
You do not need a complicated portfolio to build serious long-term wealth as a Canadian investor. Three ETFs — one covering Canadian stocks, one covering global stocks, one covering bonds — give you exposure to thousands of companies worldwide at a blended MER of approximately 0.17%. That is roughly one-tenth the cost of a typical bank mutual fund. Total annual maintenance: about 30 minutes.
That is the whole strategy.
The reason most Canadian investors do not know this is that the financial industry has a structural incentive to make investing feel complicated. Complicated means you need help. Help means fees. And fees, as anyone who has looked at a Canadian bank mutual fund MER lately knows, compound into an enormous amount of money over a 25-year investing horizon.
A well-structured 3-ETF portfolio has historically performed comparably to the majority of actively managed Canadian mutual funds over long periods — not because of any clever timing or security selection, but because it kept costs low, stayed diversified, and did not get in its own way. This guide covers which ETFs are commonly used, what allocations look like for different situations, the actual cost breakdown, and how to rebalance without overcomplicating it.
What Is a 3-ETF Portfolio?
A 3-ETF portfolio uses three exchange-traded funds, each covering a different slice of the market, held together in a single account.
The approach comes from index investing — the philosophy that instead of trying to pick winning stocks or time the market, you own the whole market at the lowest possible cost. Each ETF in this structure holds hundreds or thousands of individual securities. Buying a single share of a Canadian equity ETF, for example, gives you exposure to every major company listed on the Canadian stock exchange.
Why three specifically? Because three covers the core building blocks of a diversified portfolio without adding unnecessary complexity. One ETF for Canadian stocks. One for global stocks. One for bonds. That combination gives you geographic diversification, currency exposure, and a stability buffer.
It is worth being direct about one thing before going further. A single all-in-one ETF achieves something structurally similar with even less decision-making involved. For investors who want the simplest possible approach, a single all-in-one fund covers similar ground with no allocation decisions required. The 3-ETF structure makes more sense for investors who want control over their specific bond allocation, a slightly lower combined MER through individual fund selection, or a clearer view of each component of their portfolio.
Neither approach is wrong. The right structure is the one an investor will actually maintain consistently over a long time horizon.
For context on how MER differences compound over time, the guide on how MER impacts long-term investment returns covers the math in detail.
The Three Building Blocks
Every Canadian 3-ETF portfolio is built from the same three components. Here is what each one does and which ETFs are commonly used as examples in the Canadian index investing community.
Block 1 . Canadian Equities
This ETF provides exposure to the Canadian stock market, primarily banks, energy companies, materials, and telecoms. Two commonly referenced options are ZCN from BMO and XIC from iShares, both tracking the S&P/TSX Capped Composite Index at an MER of 0.06%. They are structurally near-identical.
Why hold Canadian stocks at all when Canada represents only about 3% of global market capitalisation? Two practical reasons. First, Canadian dividends receive favourable tax treatment in non-registered accounts under the dividend tax credit. Second, holding some Canadian equity reduces currency risk — a portfolio that is entirely in global ETFs is fully exposed to Canadian dollar movements relative to other currencies.
A common allocation is 20% to 30% of the total portfolio. That is a deliberate home bias — more than Canada’s global weight — and it is a recognized structural choice among Canadian index investors. It is worth understanding it as a choice, not a default.
Block 2 . Global Equities
This is the largest holding and the primary growth engine. It provides exposure to thousands of companies across the US, Europe, Asia, and emerging markets.
XAW from iShares, at an MER of 0.22%, is one commonly used option covering the global equity market outside Canada in a single fund — US stocks, international developed markets, and emerging markets together. For investors who want lower cost and are comfortable with US equity concentration, VFV from Vanguard tracks the S&P 500 at 0.09% MER, with the trade-off of excluding international diversification.
Common allocation range: 45% to 60% of the total portfolio.
ETF examples in this section are used for educational illustration only and are not investment recommendations. Comparable products from other providers may exist. Verify current MERs on the fund provider’s website before making any investment decisions.
Block 3 . Canadian Bonds
Bonds serve a specific function in this structure. They are not primarily a return driver — they are a volatility buffer designed to reduce the size of drawdowns during equity market declines, which in practice helps investors stay invested rather than selling at the bottom.
ZAG from BMO and VAB from Vanguard both track the Canadian aggregate bond market at an MER of 0.09%. Both hold a mix of government and corporate bonds across various maturities, and both are near-identical in composition and cost.
How much to hold depends on time horizon and risk tolerance. An investor under 40 with a stable income and a long horizon may choose a 0% bond allocation. An investor who found the 2022 market decline genuinely difficult to sit through may prefer 20% to 40% in bonds, accepting a drag on long-term returns in exchange for a smoother experience and reduced temptation to sell during volatility.
Sample Allocations for Three Portfolio Profiles
The three allocations below illustrate how different investors might structure the same three components based on their situation. These are structural examples, not personalized recommendations. The right allocation for any individual depends on their specific timeline, income stability, tax circumstances, and how they have historically responded to portfolio losses.
| Investor type | ZCN (Canadian) | XAW (Global) | ZAG (Bonds) |
| Growth | 30% | 70% | 0% |
| Balanced | 25% | 55% | 20% |
| Conservative | 20% | 40% | 40% |
These allocations are illustrative examples only. They do not represent personalized investment recommendations or suitability assessments for any individual investor.
Growth-oriented (long timeline, high volatility tolerance)
Thirty percent Canadian equities, seventy percent global equities, zero bonds. Historically, an equity-only portfolio experiences larger drawdowns — in 2022, a portfolio structured this way fell approximately 15% to 20% — but also has higher long-term expected returns. Appropriate for investors with a long time horizon who have demonstrated the ability to hold through market volatility without selling.
Balanced (moderate timeline, moderate volatility tolerance)
Twenty-five percent Canadian, fifty-five percent global, twenty percent bonds. The bond allocation has historically softened maximum drawdowns by several percentage points while giving up only a modest amount of long-term return. This allocation is commonly used by investors who want diversification across both equities and fixed income.
Conservative (shorter timeline, lower volatility tolerance)
Twenty percent Canadian, forty percent global, forty percent bonds. The heavier bond allocation reduces portfolio sensitivity to equity market swings. A 30% equity market decline translates to roughly an 18% portfolio decline at this allocation. Commonly seen in portfolios where the investment horizon is shorter or where the investor has a demonstrated preference for stability over growth.
To model how different allocations affect long-term outcomes with your specific contribution amount and time horizon, the investment growth calculator allows you to run the numbers directly.
What Does This Portfolio Actually Cost?
This is where the 3-ETF approach differs most significantly from the alternatives. Here is the actual math.
Using the growth-oriented allocation as an example — 30% ZCN and 70% XAW — the blended MER calculation works as follows:
- 30% × ZCN at 0.06% = 0.018%
- 70% × XAW at 0.22% = 0.154%
- Blended MER: approximately 0.172% per year
On a $100,000 portfolio, that is $172 annually. Here is how that compares to other structures:
| Portfolio type | Annual cost on $100,000 |
| 3-ETF portfolio (growth) | ~$172 |
| All-in-one ETF | ~$200 |
| Managed robo-advisor portfolio (example: 0.70% combined) | ~$700 |
| Typical Canadian bank equity mutual fund | ~$2,000 to $2,500 |
Platform and product examples used in this table are for illustrative cost comparison only and do not constitute a platform endorsement or recommendation. Comparable products from other providers may exist. Verify current fees on each provider’s website.
The gap between the 3-ETF structure and a typical bank mutual fund is not a rounding error. It is $1,800 to $2,300 per year on a $100,000 portfolio, before compounding. Over 25 years, that difference — reinvested at the same market return — compounds into a very significant sum.
For a full comparison of what Canadian investors typically pay in ETF versus mutual fund fees over different time horizons, see the ETF fees vs mutual fund fees comparison.
For context on what a reasonable MER looks like across different fund types, see what is a good MER for ETFs in Canada.
How to Rebalance a 3-ETF Portfolio
Rebalancing is the one maintenance task this structure requires. Here is what it involves.
Over time, markets drift. If global equities have a strong year, the XAW position grows larger than its target and the portfolio shifts away from its intended allocation. Rebalancing restores the original risk level. The goal is not market timing — it is maintaining the risk structure that was chosen at the outset.
Contribution-based rebalancing
When adding new money to the portfolio — monthly contributions, an annual lump sum, or any other schedule — direct that money toward whichever ETF has drifted below its target allocation. No selling required. No transaction fees. No capital gains event.
This approach works well for most investors who are still in accumulation phase and adding money consistently. Regular contributions tend to handle drift naturally without any deliberate rebalancing action.
Sell-and-buy rebalancing
When the portfolio has drifted significantly — more than five percentage points from target — or when no new contributions are being made, selling the overweight position and buying the underweight one restores the allocation.
Inside a TFSA or RRSP, this has no tax consequences. Inside a non-registered account, selling an appreciated position triggers a capital gains event — worth being aware of before acting.
How often? Once per year is sufficient for most situations. The research on rebalancing frequency is clear: the performance difference between monthly and annual rebalancing is small enough to be insignificant for most investors. Annual keeps the process simple.
For a detailed look at how different rebalancing frequencies affect backtested outcomes, the Portfolio Visualizer guide covers exactly how to model this.
3-ETF Portfolio vs All-in-One ETF: Structural Differences
Both structures achieve broad global diversification at low cost. Here is how they differ structurally.
A single all-in-one ETF holds a fixed asset allocation — typically 100% equity, 80/20, 60/40, or 40/60. It rebalances automatically, requires no allocation decisions, and is managed entirely within a single ticker. The MER on most Canadian all-in-one ETFs is approximately 0.20%.
A 3-ETF structure gives the investor direct control over their asset allocation. The bond percentage can be set to any level — 15%, 35%, or anything else — rather than being constrained to a fixed option. The blended MER can be modestly lower depending on which individual ETFs are selected. And each component of the portfolio is visible separately, which some investors find easier to understand and maintain conviction in during volatile periods.
Neither structure is inherently superior. The relevant considerations are:
- Do you want control over your exact bond allocation, or is a fixed option acceptable?
- Is a modestly lower blended MER worth the additional step of allocating across three positions?
- Do you prefer to see each component of your portfolio separately, or does one consolidated fund suit your approach better?
Both structures are widely used by Canadian index investors. The choice depends on what an individual investor will actually maintain consistently over time.
How the Account Setup Process Generally Works
This section describes a general process for educational purposes only. It does not constitute financial or investment advice. The ETF types and account structures mentioned are used as illustrative examples. Before making any investment decision, consider your own financial situation and consult a registered financial advisor.
The general steps involved in implementing a 3-ETF structure through a self-directed brokerage:
Step 1. Open a registered account. Most Canadian investors implementing this structure start with a TFSA, where growth and withdrawals are tax-free and contribution room is flexible. An RRSP is also commonly used, particularly for investors in higher income years. The account type that makes sense depends on individual tax circumstances.
Step 2. Fund the account. Most Canadian self-directed brokerages accept funding via bill payment or electronic funds transfer from a Canadian bank account. Minimum deposit requirements vary by institution — verify current terms before opening.
Step 3. Research and select your ETFs. Canadian equity ETFs, global equity ETFs, and Canadian bond ETFs are all available through major Canadian discount brokerages. ETFs like ZCN, XAW, and ZAG are commonly referenced examples in the Canadian index investing community. Most self-directed platforms allow searching by ticker, reviewing fund details including MER and holdings, and placing purchase orders. Verify current MERs on each fund provider’s website before investing.
Step 4. Set up a contribution schedule. Many investors automate a monthly transfer from their bank and direct new contributions toward whichever ETF has drifted below its target allocation. This keeps the portfolio roughly balanced without requiring active management decisions.
For a step-by-step guide to how the TFSA account setup process works at one commonly used Canadian brokerage, see the Questrade TFSA guide. For a comparison of platform features across two widely used options, see the Questrade vs Wealthsimple comparison.
Conclusion
The 3-ETF portfolio structure combines three low-cost index ETFs to achieve broad global diversification at a blended cost of approximately 0.17% per year — roughly one-tenth the cost of a typical Canadian bank mutual fund. Annual maintenance involves checking allocation drift once and making any necessary adjustments, which most investors complete in under an hour.
That is not a simplified pitch. That is what the cost structure actually looks like when the numbers are run.
The structure does not guarantee returns, and it does not eliminate the risk of market losses. What it does is remove two of the variables that have historically worked against long-term investors: high fees and unnecessary complexity. Whether this structure is appropriate for a given investor depends on their specific financial situation, timeline, and goals — factors this article cannot assess.
To model how this structure might perform over your specific horizon with your actual contribution amounts, the investment growth calculator allows you to run different scenarios with your own numbers.
Frequently Asked Questions
A 3-ETF portfolio is a portfolio structure using three low-cost index ETFs to achieve broad global diversification. For Canadian investors it typically includes a Canadian equity ETF, a global equity ETF, and a Canadian bond ETF. Together they cover thousands of companies worldwide at a blended MER commonly under 0.20%. ETF examples referenced here are illustrative only and are not investment recommendations.
Commonly referenced Canadian 3-ETF combinations include a Canadian equity ETF such as ZCN (BMO, MER 0.06%) or XIC (iShares, MER 0.06%), a global equity ETF such as XAW (iShares, MER 0.22%), and a Canadian bond ETF such as ZAG (BMO, MER 0.09%) or VAB (Vanguard, MER 0.09%). These are used as educational examples. The specific ETFs and allocations that suit any investor depend on their individual goals, timeline, and risk tolerance. Always verify current MERs on the fund provider’s website before investing. Other providers offer comparable low-cost ETFs.
A typical Canadian 3-ETF portfolio has a blended MER of approximately 0.10% to 0.20% depending on the specific ETFs and allocation. Using ZCN at 0.06% and XAW at 0.22% in a 30/70 growth allocation produces a blended MER of approximately 0.172%, about $172 per year on a $100,000 portfolio. This compares to approximately $2,000 to $2,500 annually for a typical Canadian bank equity mutual fund at a 2.0 to 2.5% MER.
Both structures achieve broad global diversification at low cost. A single all-in-one ETF provides automatic rebalancing and a fixed asset allocation in one ticker. A 3-ETF structure provides direct control over bond allocation, a potentially lower blended MER through individual ETF selection, and visibility into each portfolio component separately. Neither is inherently superior, the relevant factor is which structure an investor will maintain consistently over a long time horizon. ETF examples referenced here are illustrative only and are not investment recommendations.
Once per year is sufficient for most investors. The performance difference between monthly and annual rebalancing is small enough to be negligible for most long-term portfolios. The simplest rebalancing method is contribution-based, directing new money toward whichever ETF has drifted below its target allocation, which avoids selling entirely and eliminates capital gains considerations inside registered accounts.
Yes. Canadian-listed ETFs can be purchased inside a TFSA through major Canadian self-directed brokerages. Growth and withdrawals inside a TFSA are tax-free, which makes it a commonly used account type for long-term ETF investing. Contribution room rules apply, verify your available room via CRA My Account at canada.ca before contributing.
Common starting points range from a growth-oriented 30% Canadian / 70% global / 0% bonds for longer-horizon investors, to a balanced 25% Canadian / 55% global / 20% bonds, to a more conservative 20% Canadian / 40% global / 40% bonds. These are structural illustrations, not personalized recommendations. The appropriate allocation for any individual depends on their specific timeline, income stability, tax circumstances, and how they have historically responded to portfolio volatility. This article cannot assess suitability for any individual investor.
Multiply each ETF’s allocation weight by its MER, then add the results together. Example: 30% ZCN at 0.06% = 0.018%; 70% XAW at 0.22% = 0.154%; blended MER = 0.172%. Adding a bond ETF at 0.09% changes the blended result proportionally. This calculation gives you the effective annual fee on the combined portfolio expressed as a percentage of assets.
Disclaimer: This article is for educational purposes only and does not constitute financial, investment, or tax advice. The ETFs mentioned are used as examples to illustrate concepts, they are not personalized recommendations. Before making any investment decision, consider your own financial situation, risk tolerance, and if needed, consult a registered financial advisor.