Daily Trading vs Long-Term Investing: What Portfolio Visualizer’s 20-Year Backtests Reveal About Risk, Drawdowns, and Why Most Technical Indicators Fail
Active trading gets most of the attention in finance media. But when you run actual backtests through tools like Portfolio Visualizer, a pattern emerges that most traders never see. RSI, MACD, and moving averages are heuristics, rules of thumb based on price patterns. Portfolio Visualizer is built on statistical models using 20 or more years of data. This article explains what that difference means in practice, covering Sharpe ratios, drawdowns, correlation matrices, and why time horizon changes everything about how you read risk.
Educational Disclaimer: This article describes a portfolio structure used in Canadian index investing for educational purposes only. It does not constitute financial, investment, or tax advice. ETF examples are illustrative only and are not investment recommendations. Comparable products from other providers may exist. Consult a registered financial advisor before making any investment decisions.
Introduction
I came to this topic from the quantitative side, not the trading side. As a statistician, what always struck me about most technical indicators is that they are based on price patterns, not probability distributions. They work until they do not.
Portfolio Visualizer approaches the same questions differently. Instead of looking at price movement over a few days, it asks how a given allocation behaved across 20 years of market data, through 2008, 2020, and the 2022 inflation-driven correction. That longer lens changes what you see.
The goal here is not to argue that one approach is better than the other. It is to show what the long-term statistical tools reveal about risk and volatility that shorter-term pattern-based analysis tends to miss, and why that information is useful regardless of your time horizon.
If you are new to these tools, the following guides cover the foundation this article builds on:
- ETF asset allocation guide
- How MER affects long-term portfolio growth
- Portfolio Visualizer backtest guide for Canadian investors
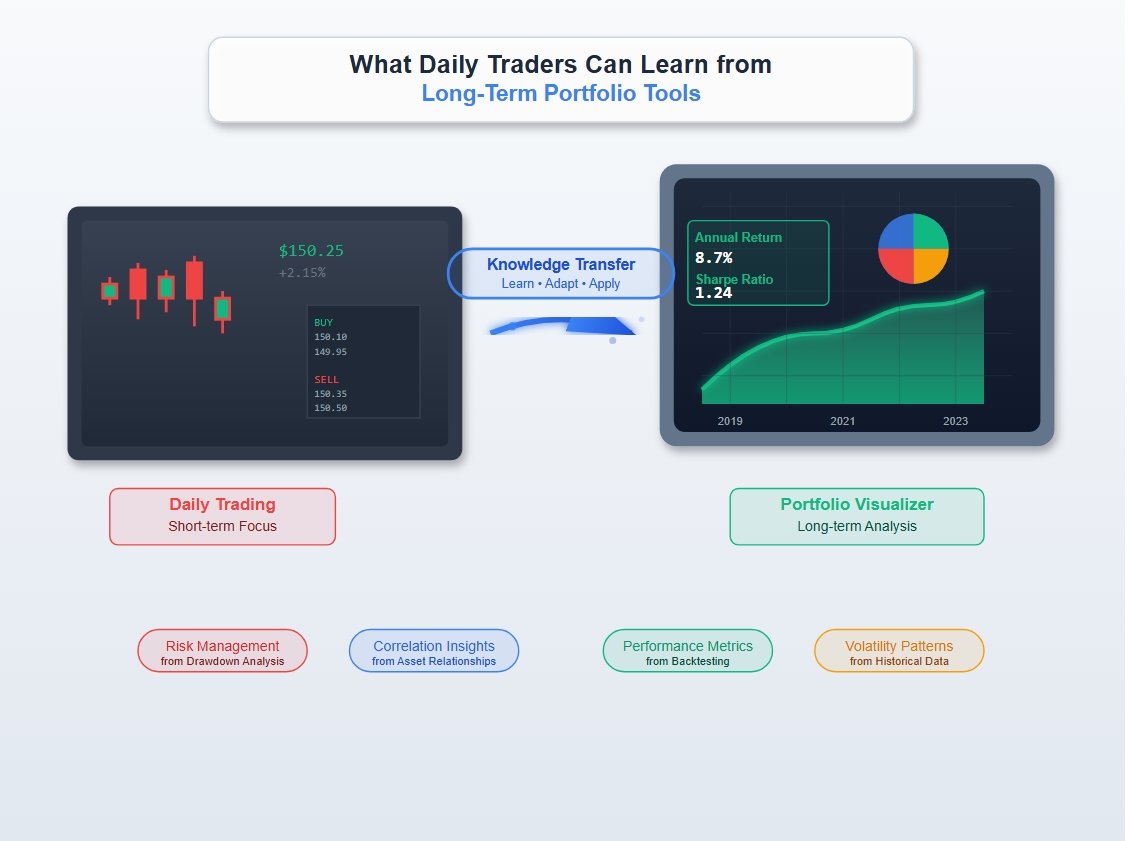
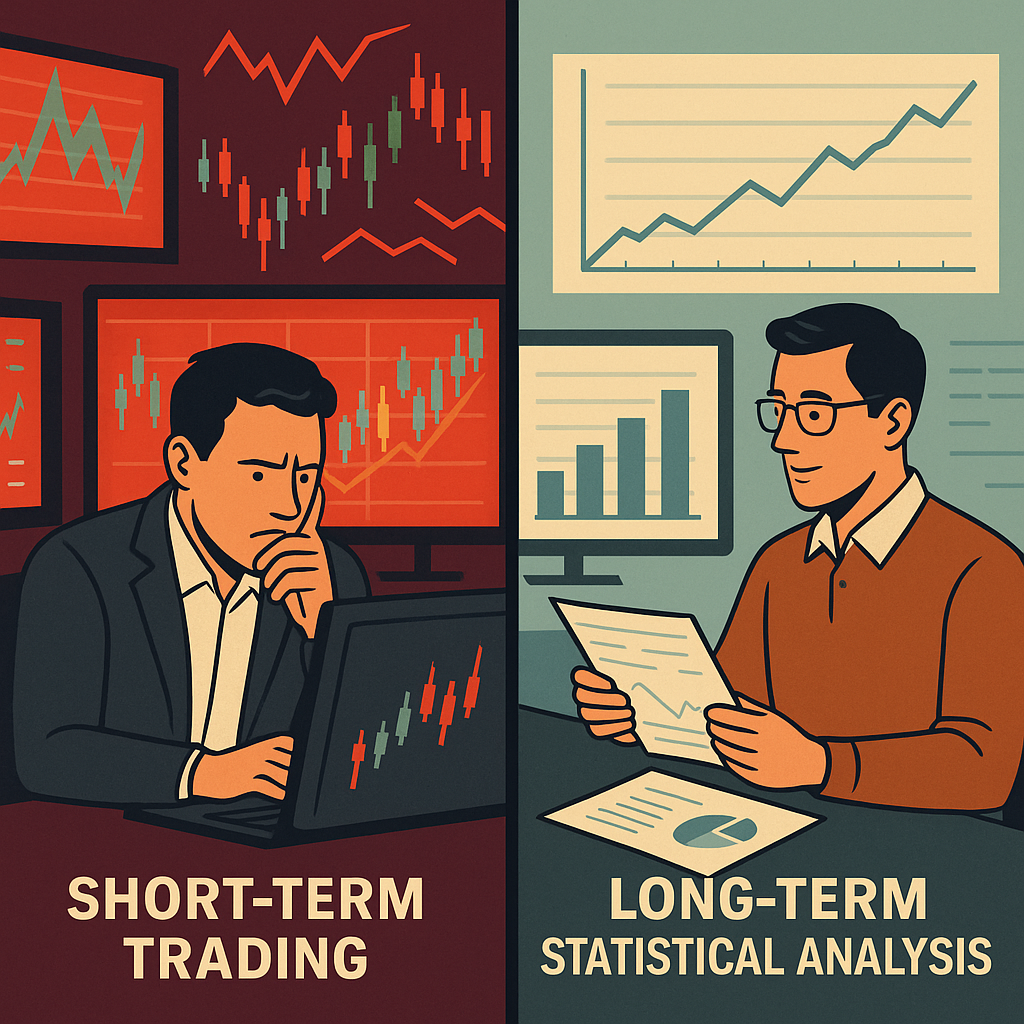
The Structural Difference Between Daily Trading and Investing
- Day trading demands speed and timing. Decisions are made in minutes or seconds.
- Long-term investing emphasizes strategy, allocation, and consistency.
As a statistician, I’ve always been drawn to the structured nature of long-term investing. It gives me the time to test models, evaluate portfolio behavior under various conditions, and ultimately build strategies that optimize for return and minimize risk.
Why Portfolio Visualizer Is a Useful Tool
Portfolio Visualizer offers tools that are indispensable to long-term investors:
- Asset allocation optimization (e.g., mean-variance optimization)
- Backtesting with historical returns and volatility
- Monte Carlo simulations
- Risk-adjusted metrics (Sharpe, Sortino, Ulcer Index)
- Correlation matrices and drawdown timelines
These tools are grounded in solid statistical reasoning. They’re not about guessing market direction, they’re about understanding risk and reward.
How This Helps Short-Term Traders Too
Even if you’re an active trader, you benefit from understanding an asset’s long-term behavior. Here’s how:
- Volatility Profiles: Knowing how volatile an ETF is historically can inform your stop-loss settings.
- Correlation Insights: Recognizing how assets move together can prevent overexposure.
- Drawdown Awareness: Awareness of worst-case scenarios sharpens your risk management.
By incorporating these insights, even short-term traders can approach risk with more statistical context, rather than relying solely on pattern-based heuristics that do not account for structural market variables.
Bridging the Gap Between Intuition and Data
Most technical indicators are based on heuristics. Portfolio Visualizer, by contrast, roots its analysis in tested statistical frameworks. As a result, it helps investors of all types develop better intuition:
- You understand how assets behave over time.
- You recognize recurring patterns across macro cycles.
- You learn to respond rationally during volatile markets.
That’s valuable whether you’re rebalancing a TFSA or trying to time a trade during earnings season.
What Do We Mean by “Most Technical Indicators Are Based on Heuristics”?
Heuristics are rules of thumb, simple, experience-based guidelines or shortcuts that traders use to make decisions.
They’re not grounded in statistical theory, and they don’t test assumptions or account for uncertainty.
Examples:
- “Buy when the RSI is below 30”
- “Sell when the 50-day moving average crosses the 200-day moving average”
- “Support and resistance lines predict future price bounces”
These patterns may work sometimes, but they’re often based on visual patterns or historical habits, not statistical validation.
How Is That Different from Statistical Models?
Statistical models attempt to:
- Explain or predict relationships between variables using data
- Quantify uncertainty and confidence
- Test hypotheses and check assumptions
- Produce results that can be replicated, evaluated, and validated
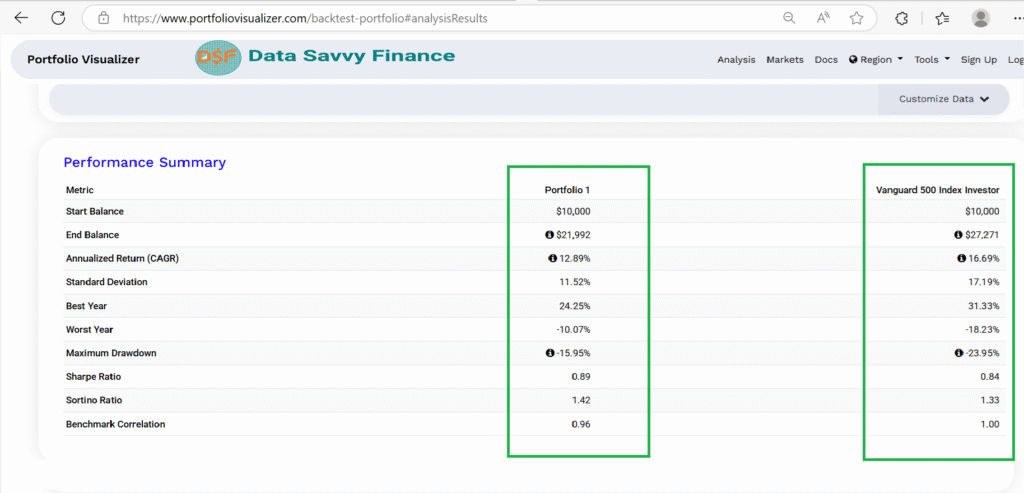
Example using Portfolio Visualizer:
- Backtesting a portfolio over 20 years to see how different asset combinations performed under real market conditions
- Computing Sharpe ratio, standard deviation, and maximum drawdown to quantify risk-adjusted performance
This isn’t just looking at patterns, but it’s asking deep questions such as:
What are the trade-offs between risk and return?
How likely is this performance due to chance?
How consistent is it across different market environments?
A Simple Analogy

A Simple Analogy
Heuristics
Statistical Models
"Red means stop"
Traffic analysis modeling accident rates
"It worked last time, so I'll try again"
"Let's test if this strategy works 95% of the time"
Gut feeling based on charts
Probability distributions and simulations
Heuristics are like educated guesses based on patterns and habits.
Statistical models are like carefully tested theories built on data and probability.
One may feel faster, but the other is more reliable over time.
Why Time Horizon Changes Everything
Most common technical indicators, like RSI, MACD, or moving averages — are based on univariate heuristics. That means they look at a single variable (like price or volume) over time, without considering other influential factors.
For example:
The RSI tells you whether an asset is “overbought” or “oversold” based only on recent price movement.
But it ignores everything else, earnings reports, interest rates, inflation, geopolitical events, or broader market sentiment.
Real Markets Are Multivariate and News-Driven
Markets don’t move in isolation. Every trading day is influenced by:
- Overnight news (economic reports, global events, central bank updates)
- Shifts in investor sentiment
- Sector rotations
- Correlations between markets (e.g., oil prices and Canadian equities)
For instance: a strong jobs report from the U.S. released after markets close might cause a surge in stock prices at the next Canadian market open, regardless of what any technical chart said yesterday.
So while technical indicators can sometimes capture patterns, they’re blind to context. That’s why they often fail during regime shifts or black swan events.
What Traders Can Borrow from Portfolio Construction
Statistical tools like those in Portfolio Visualizer allow you to:
- Model multiple variables simultaneously
- Evaluate asset behavior across different macro environments
- Simulate outcomes under a variety of real-world scenarios
- Understand not just what happened, but why and how often
Heuristics may be quick and easy, but they’re fragile.
Long-term statistical analysis embraces complexity and uncertainty, making it more resilient, informed, and ultimately more useful for building portfolios that can weather different market conditions.

Conclusion
Portfolio Visualizer is more than a backtesting tool. It is a way of asking different questions about risk. Instead of “which direction is the price moving?” it asks “how consistent is this performance across different market environments, and what is the probability distribution of outcomes over time?”
I have found that approach useful regardless of what you are doing with the output. Whether you are rebalancing a TFSA once a year or trying to understand the volatility profile of an asset before taking a position, the statistical foundation is the same. It shifts the question from pattern recognition to probability reasoning.
Long-term analysis tools do not just describe portfolios, they develop the kind of statistical thinking that shapes every investment decision. And that is the transferable skill, not the specific allocation.
Frequently Asked Questions
Heuristics are rules of thumb based on observed patterns, for example “buy when RSI falls below 30” or “sell when the 50-day moving average crosses the 200-day moving average.” They are fast and simple but are not grounded in statistical theory and do not quantify uncertainty or test assumptions. Statistical models attempt to explain relationships between variables using data, quantify confidence levels, and test whether results are replicable across different market environments. Portfolio Visualizer uses statistical models including backtests, Monte Carlo simulations, and correlation matrices, while most technical analysis indicators are heuristic-based. Neither approach eliminates uncertainty, but they describe risk very differently.
Long-term portfolio analysis tools like Portfolio Visualizer provide statistical context that heuristic trading indicators do not. Specifically, they reveal how volatile an asset is historically across full market cycles, how different assets correlate under different market conditions, what the worst-case drawdown scenarios have looked like over 20 or more years, and what risk-adjusted return metrics like the Sharpe ratio and Sortino ratio look like across different allocation structures. This context can inform stop-loss setting, position sizing, and risk management decisions even for traders operating on shorter time horizons. The tools do not predict short-term price movements, but they provide a statistical baseline that pure technical analysis does not.
RSI, MACD, and most moving average indicators are univariate, meaning they analyse a single variable, typically price or volume, in isolation. They do not account for earnings reports, interest rate changes, inflation data, geopolitical events, or correlations with other markets. These external factors can override whatever pattern a technical indicator is signalling at any moment. This is why technical indicators often fail during regime shifts, black swan events, or periods when macro drivers dominate market behaviour. Statistical models that incorporate multiple variables and test performance across different market environments tend to be more robust because they account for a wider range of market conditions rather than just recent price history.
The Sharpe ratio measures an investment’s return relative to the risk taken, expressed as return per unit of volatility. A ratio above 1.0 is generally considered strong. The reason it matters for traders is that it separates raw return from risk-adjusted return. A strategy that produces 15% annual returns with extreme volatility may have a lower Sharpe ratio than one producing 10% with low volatility, meaning the second strategy generates more return per unit of risk accepted. Portfolio Visualizer calculates the Sharpe ratio across the full backtest period, which allows comparison of different allocation structures or strategies on a risk-adjusted rather than raw return basis.
Maximum drawdown is the largest peak-to-trough decline in portfolio value during a given period, expressed as a percentage. It is calculated by identifying the highest portfolio value during the period, finding the lowest value that followed before a new high was reached, and dividing the difference by the peak value. In Portfolio Visualizer’s backtest output, maximum drawdown shows the worst historical loss an investor would have experienced holding a given allocation, along with how long recovery to the prior peak took. For both long-term investors and active traders, maximum drawdown is one of the most practically meaningful risk metrics because it represents actual capital loss rather than abstract volatility statistics.
This article does not make a recommendation between day trading and long-term investing, as both involve different skill sets, time commitments, risk profiles, and capital requirements that vary significantly across individual circumstances. Academic research consistently shows that the majority of retail day traders underperform passive index strategies over multi-year periods, primarily due to transaction costs, taxes, and behavioural errors. Long-term passive strategies have historically produced strong risk-adjusted returns over 10-plus year periods. However, individual results vary and past performance does not guarantee future results. This article focuses on what statistical portfolio analysis tools reveal about risk, not on which approach is better for any individual investor.